
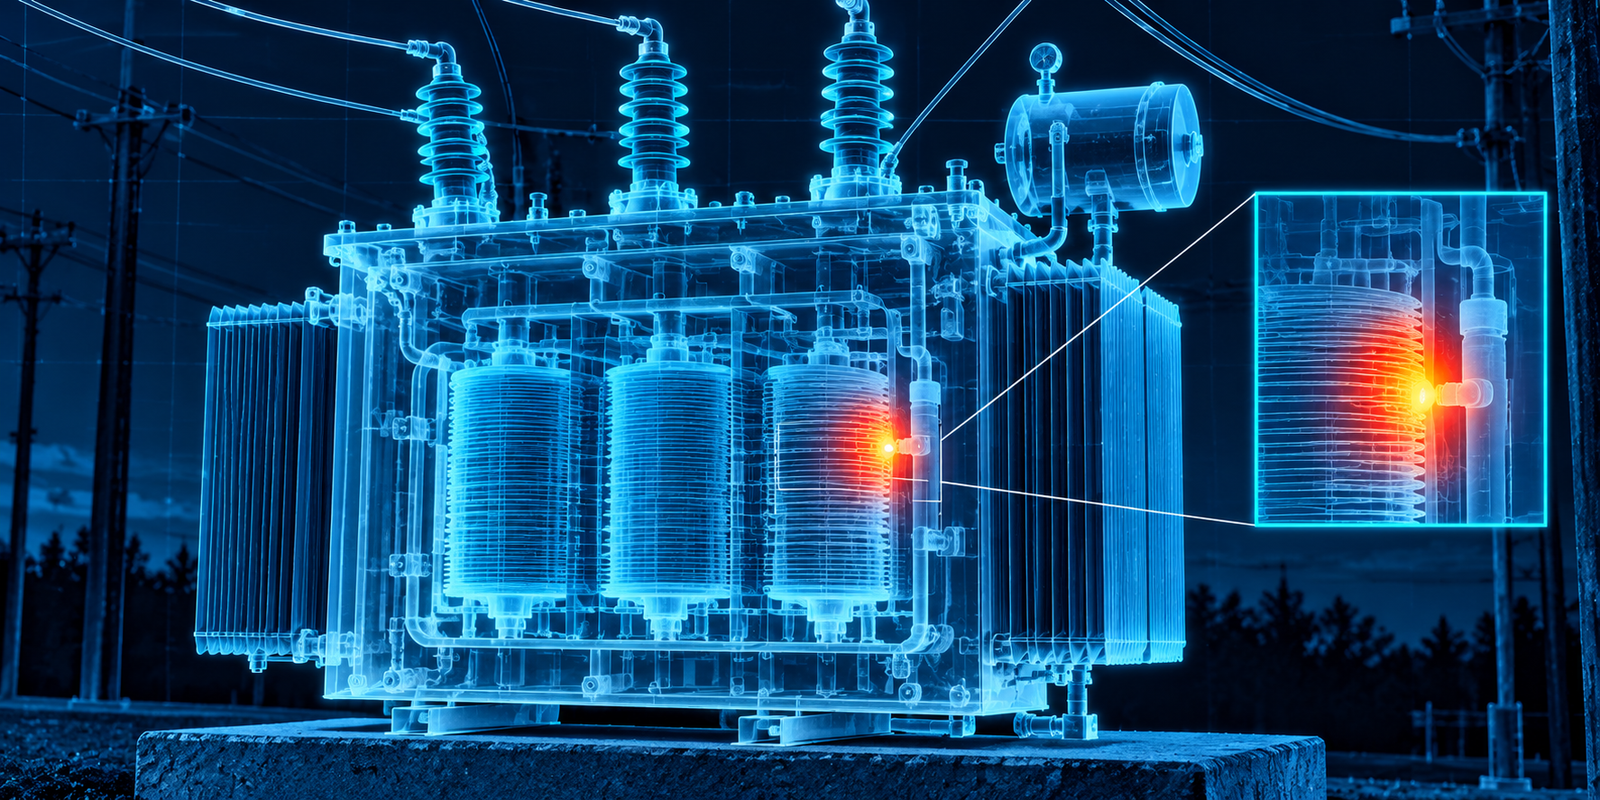
AI predictive maintenance for electric utilities uses sensor, asset and operational data, together with machine learning (ML), to detect abnormal equipment behavior and estimate maintenance or failure risk. The output is a risk signal that helps engineers decide which assets to inspect, test or service first. It is not a promise that a specific asset will fail on a specific day.
Utility assets such as transformers, circuit breakers and switchgear are expensive, long-lived and critical to reliability. Many sit in remote or hard-to-inspect locations. Calendar-based maintenance treats similar assets alike, even though their loading, environment and condition differ. Meanwhile, sensors, SCADA, alarms and maintenance records keep producing data that shows how assets actually behave. AI and ML can find patterns in that data that fixed thresholds and manual review may miss.
This article follows one chain from data to action:
Sensor Data → Asset Condition → Feature Engineering → AI/ML Model → Health/Anomaly Signal
→ Failure Risk → Maintenance Decision → Engineering Validation → Maintenance Action → Feedback
It is about electric utility assets specifically. For the wider picture, see how AI is transforming electric utilities and top AI applications in the electricity industry.
Key Takeaway
- AI predictive maintenance combines asset condition data, operational information and AI/ML models to identify abnormal behavior and estimate maintenance or failure risk.
- Its purpose is to help utilities prioritize engineering investigation and maintenance.
- It supports decisions. It does not predict the exact time of every failure.
- Data quality, domain knowledge and engineering validation determine whether the output is useful.
What Is AI Predictive Maintenance?
AI predictive maintenance uses data-driven models to estimate the condition and risk of equipment so maintenance can be planned from evidence rather than only from a fixed calendar.
Conventional predictive maintenance often relies on engineered limits, such as an alarm when temperature exceeds a set value. AI adds the ability to learn patterns across many variables at once, for example how temperature, load, ambient conditions and event history interact.
How AI, machine learning and predictive analytics relate
- Artificial intelligence is the broad field of systems that perform tasks needing pattern recognition or judgment.
- Machine learning is the subset that learns patterns from data.
- Predictive analytics is the practice of using data to estimate future or unknown outcomes. It may use ML or classical statistics.
What “failure risk” means
Failure risk is an estimate of how likely an asset is to develop an abnormal or failed condition over a defined time horizon, based on available evidence. It is a probability-style signal with uncertainty, not a verdict.
Predictive maintenance does not equal guaranteed failure prediction. Depending on data and model, AI generally estimates abnormal behavior, condition, probability or risk, or remaining-useful-life-related indicators. Treat it as decision support.
Why Predictive Maintenance Matters for Electric Utilities
Utility assets differ from many industrial assets in several ways:
- High asset value: a large power transformer is costly and slow to replace.
- Long operating life: equipment may run for decades, so aging is a real issue.
- Critical reliability requirements: a single failure can affect many customers.
- Distributed equipment: thousands of assets spread across a large territory.
- Difficult inspection conditions: energized, remote or enclosed equipment.
- Aging infrastructure and renewable integration, which change loading patterns.
- Growing monitoring capability and a need for better prioritization of limited maintenance effort.
Asset failures can affect reliability and outage risk, maintenance planning, crew requirements, replacement decisions, operational continuity and safety. For the causes behind such events, see what causes power grid failures.
Maintenance Types Compared
| Term | Meaning |
|---|---|
| Corrective maintenance | Repair after a failure or fault occurs |
| Preventive maintenance | Scheduled work at fixed time or usage intervals |
| Condition-based maintenance | Work triggered when measured condition crosses a defined limit |
| Predictive maintenance | Work planned from evidence about developing condition and expected risk |
| Asset health monitoring | Tracking the current condition of assets, often with indexes or scores |
| Anomaly detection | Identifying behavior that differs from what is expected |
| Failure prediction | Estimating likelihood of failure over a horizon |
| Failure risk assessment | Combining likelihood with consequence to rank assets |
Predictive Maintenance Workflow
Sensor / Operational Data
↓ Data Collection
↓ Data Quality
↓ Feature Engineering
↓ Baseline / Normal Behavior
↓ AI/ML Model
↓ Anomaly / Health Signal
↓ Failure-Risk Assessment
↓ Asset Prioritization
↓ Engineering Validation
↓ Maintenance Decision
↓ Maintenance Action
↓ Feedback / Model Improvement
- Sensor / operational data: measurements and records from equipment and systems.
- Data collection: transport into a platform through networks, SCADA or IoT gateways.
- Data quality: checks for gaps, drift, duplicates and timestamp problems.
- Feature engineering: turning raw data into informative inputs such as trends and rates of change.
- Baseline: a picture of normal behavior for each asset or asset group.
- AI/ML model: scores deviation, condition or risk.
- Anomaly / health signal: an indication that behavior or condition is changing.
- Failure-risk assessment: estimates likelihood over a horizon, combined with consequence.
- Asset prioritization: ranking assets for attention.
- Engineering validation: experts check whether the signal is real and meaningful.
- Maintenance decision: inspect, test, repair, monitor or take no action.
- Maintenance action: the work is done and findings recorded.
- Feedback: outcomes return to improve models and thresholds.
Data Sources for AI Predictive Maintenance
Not every asset has every data source. A modern monitored transformer may have many, while an older distribution asset may have only age, location and inspection notes. Models must be designed around what is actually available.
| Category | Examples |
|---|---|
| Electrical and thermal | Temperature, current, voltage, load |
| Mechanical and physical | Vibration, pressure where applicable |
| Insulation and fluid condition | Oil condition, dissolved gas analysis, partial discharge where applicable |
| Operations and events | Breaker operation counts, switching events, protection events, alarm and event logs |
| Systems | SCADA data, IoT sensors, AMI data where relevant |
| Context | Weather, operating environment, GIS and location information |
| Asset records | Asset age, manufacturer information, maintenance history, inspection records, failure history |
For how sensors and IoT devices generate such data, see how sensors and IoT devices are changing grid operations.
Utility Asset Data Architecture
Asset / Sensor
→ IoT / Edge Device
→ Communication Network
→ Data Collection Platform
→ Historian / Operational Data Store
→ Data Quality Layer
→ Feature Engineering
→ AI/ML Platform
→ Asset Health / Risk Model
→ Analytics Dashboard
→ Utility Maintenance / Asset Management System
- SCADA often supplies real-time measurements and alarms from substations.
- IoT platforms and edge devices collect data from newer sensors.
- Historians store time-series data for trend analysis.
- Data lakes and enterprise platforms combine time-series, asset and maintenance data.
- Analytics and ML platforms host models and scoring.
- Asset-management systems hold asset records and receive work recommendations.
This is a common pattern, not a universal design. Each utility’s architecture depends on its systems, vendors and policies.
AI and Machine Learning Methods
| Approach | What It Does | When Useful | Main Limitation |
|---|---|---|---|
| Rule-based monitoring | Applies engineering limits and logic | Known limits and alarms | Cannot learn complex patterns |
| Statistical methods | Control limits, trends, distributions | Simple baselines | Weak with changing conditions |
| Regression | Predicts an expected value or indicator | Expected temperature for a given load | Depends on model fit |
| Classification | Assigns a class such as normal or abnormal | Labeled historical cases | Needs reliable labels |
| Decision trees | Rule-like splits on features | Explainable decisions | Can overfit alone |
| Random forests | Many trees combined | Mixed, tabular asset data | Less transparent |
| Gradient boosting | Sequentially improved trees | Strong tabular performance | Needs careful tuning |
| Support vector machines | Separates classes by a boundary | Smaller datasets | Scales less well |
| Clustering | Groups similar assets or behavior | Finding asset groups without labels | Clusters need interpretation |
| Isolation Forest | Isolates unusual observations | Unlabeled anomaly screening | Unusual is not faulty |
| Autoencoders | Learn to reconstruct normal data | Multivariate sensor patterns | Harder to explain, data-hungry |
| Time-series models | Model temporal patterns | Trends and seasonality | Sensitive to structural change |
| Neural networks | Learn complex nonlinear patterns | Large, rich datasets | Data needs and low transparency |
| Remaining useful life approaches | Estimate time-related condition indicators | Degradation with measurable progression | Needs run-to-failure style evidence |
| Survival analysis | Models time to event with censored data | Asset populations with history | Needs good lifetime records |
| Hybrid engineering + AI | Combines physics or rules with ML | Most practical utility cases | More design effort |
Deep learning is not automatically better. For many utility problems, simpler and more explainable models perform comparably and are easier to validate. See machine learning vs traditional utility analytics for a decision framework.
Feature Engineering for Utility Assets
Raw sensor data rarely feeds a model directly. Features turn it into signals that reflect asset behavior.
- Temperature trends and rate of temperature change.
- Load patterns and loading conditions, including time spent near rated capacity.
- Vibration features, including frequency-domain features where appropriate.
- Operating hours and number of switching operations.
- Alarm frequency and event frequency.
- Historical maintenance indicators.
- Weather exposure and seasonal behavior.
- Asset age.
Domain knowledge matters here. An engineer knows that transformer temperature should be read against load and ambient temperature, or that breaker operation counts matter differently by breaker type. Without that knowledge, a model may learn the wrong relationships.
Asset Health Monitoring
Asset health monitoring tracks current condition using indicators such as condition scores, health indexes, risk scores, alarm thresholds, trend analysis and baseline comparison.
Asset health is not failure probability. A health index summarizes condition. Failure probability estimates the chance of failure over a horizon. Different utilities and vendors define health indexes differently, so scores should not be compared across systems without understanding the definition.
Failure Risk Estimation
AI can help estimate the probability of an abnormal condition, relative asset risk, failure likelihood over a defined horizon, condition deterioration and maintenance priority. Several factors determine whether such estimates can be trusted:
- Time horizon: risk over 30 days differs from risk over five years.
- Historical failure data: failures are rare, which limits learning.
- Asset population: a model trained on one asset type may not suit another.
- Calibration: a stated risk of 10% should correspond to events happening about that often.
- Confidence and uncertainty: outputs should carry some indication of how reliable they are.
- False positives and false negatives: unnecessary inspections versus missed developing problems.
No accuracy percentages are quoted in this article. Performance depends entirely on each utility’s data and asset population.
Transformer Predictive Maintenance
Transformers offer rich condition data. Possible signals include:
- Winding and top-oil temperature, and load.
- Oil-related measurements where available, and moisture where applicable.
- Dissolved gas analysis (DGA), where gases in oil can indicate certain internal conditions.
- Bushing condition data where available.
- Partial discharge where applicable.
- Maintenance history and alarm or event data.
AI may identify changing patterns, such as temperature rising faster than load would explain or a gradual shift in gas readings relative to the unit’s own history. Interpreting what those shifts mean still needs transformer engineering expertise. A hypothetical case appears in the examples below.
Circuit Breaker and Switchgear Predictive Maintenance
Circuit breakers and switchgear involve mechanical and electrical wear. Useful data includes:
- Operation counts and operating time.
- Current interruption history.
- Temperature, and contact condition where measurable.
- Mechanical behavior, such as travel or timing characteristics.
- Alarm and event records.
- Vibration or acoustic signals where applicable.
AI can support condition monitoring by flagging changes in operating-time patterns or unusual event sequences, and help prioritize which breakers to inspect first. Some measurements need dedicated monitoring devices, so coverage varies. See also digital substations for how substation data is increasingly available.
Transmission and Distribution Asset Monitoring
Applications span transmission equipment, distribution transformers, substations, switchgear, feeders, cables where applicable and other monitored assets. Transmission assets are fewer and often heavily instrumented. Distribution assets are numerous and often lightly monitored, so approaches such as fleet-level comparison and use of AMI data where relevant can help. For distribution assets, meter-derived loading information can approximate transformer loading, though quality varies.
Prioritization should combine condition with asset criticality. A moderately concerning transformer feeding a hospital feeder may deserve earlier attention than a more degraded unit with low consequence and backup supply.
AI Predictive Maintenance vs Anomaly Detection
| Aspect | Predictive Maintenance | Anomaly Detection |
|---|---|---|
| Objective | Plan maintenance from condition and risk | Find behavior that differs from normal |
| Input data | Condition, operational, history and failure data | Often sensor or operational data alone |
| Output | Risk, health or priority estimate | Anomaly score or flag |
| Time horizon | Looks ahead over a defined horizon | Mostly current or recent behavior |
| Typical use | Maintenance planning and prioritization | Screening and alerting |
| Maintenance relevance | Direct | Indirect, as an input |
| Limitations | Needs history and validation, uncertainty | Unusual does not mean faulty |
An anomaly is not automatically a failure. Anomaly detection may be one input into predictive maintenance. See AI anomaly detection in electric utilities for more.
AI Predictive Maintenance vs Preventive Maintenance
| Strategy | Trigger | Data Requirement | Timing | Advantages | Limitations | Typical Utility Use |
|---|---|---|---|---|---|---|
| Corrective | Failure or fault | Minimal | After the event | Simple, no monitoring cost | Unplanned outages, higher consequence | Low-criticality, easily replaced assets |
| Preventive | Calendar or usage interval | Asset records | Scheduled | Predictable planning | May service healthy assets or miss developing issues | Routine inspection programs |
| Condition-based | Measured condition crosses a limit | Condition measurements | When limit reached | Reduces unnecessary work | Reacts to limits, not trends | Monitored transformers and breakers |
| Predictive | Evidence of developing condition | Condition plus history and trends | Ahead of expected need | Better planning | Needs good data and validation | Critical, monitored assets |
| AI-assisted predictive | Model-estimated risk or anomaly | Rich, quality data and history | Ahead of expected need | Finds complex patterns, scales to fleets | Rare failures, explainability, drift | Pilots and growing deployments |
These strategies coexist. Most utilities use a mix, with AI-assisted methods added where data and criticality justify them.
AI for Asset Health and Risk Prioritization
Asset Condition + Asset Criticality + Failure Risk + Operational Impact + Maintenance History
→ Maintenance Priority
Combining these gives a more useful ranking than any one alone. Condition and failure risk say how concerning the asset is. Criticality and operational impact say how much it matters. Maintenance history adds context about past work.
A high-risk asset is not necessarily an asset that will fail soon. Risk prioritization should support engineering judgment, not replace it.
Data Quality Challenges
Poor data produces unreliable AI output. Common issues include:
- Missing sensor data and incorrect readings.
- Sensor drift and calibration issues.
- Communication failures and timestamp problems.
- Duplicate data and inconsistent units.
- Changing sensor configurations.
- Limited historical failures and sparse failure events.
- Asset metadata problems, such as wrong ratings or locations.
A drifting temperature sensor can look like a degrading asset, while a stale value can hide a real change. Quality checks belong before modeling. Similar issues arise in meter data; see smart meter data quality.
Model Training and Validation
Models are trained on historical data after feature preparation, then evaluated on data they have not seen. Key practices include:
- Training, validation and test sets kept separate.
- Time-based validation and backtesting: train on earlier periods and test on later ones.
- Cross-validation where appropriate, designed to respect time and asset groupings.
- Handling class imbalance: failures are rare compared with normal operation.
- Metrics: precision (how many alerts were real), recall (how many real problems were caught), false positives and false negatives, ROC-AUC where appropriate, and calibration.
- Model monitoring after deployment.
Random train/test splitting can be inappropriate for time-series utility problems. Randomly mixing records from the same asset and period lets the model see near-copies of test data during training, which overstates performance. Accuracy alone is misleading when failures are rare, because a model that never predicts failure can still appear accurate.
Model Drift and Changing Asset Behavior
Models degrade when the world changes. Causes include asset aging, new equipment, changing operating conditions, renewable generation, electrification and EV adoption, changes in loading, maintenance interventions, sensor replacement, and seasonal and environmental changes.
Utilities handle drift by monitoring input distributions and model performance, reviewing baselines after known changes, and retraining on updated data. A maintenance intervention is a special case: a repaired asset may legitimately behave differently afterward.
Real-Time vs Batch Predictive Maintenance
| Aspect | Real-time / Near-Real-Time | Batch / Periodic |
|---|---|---|
| Data flow | Continuous streaming | Collected and processed in intervals |
| Latency | Seconds to minutes | Hours to days or longer |
| Infrastructure | Streaming platforms, edge, reliable communications | Historians, data lakes, scheduled jobs |
| Use cases | Fast-developing conditions, operational alerts | Trend analysis, fleet ranking, inspection planning |
| Advantages | Faster awareness | Simpler, uses complete validated data |
| Limitations | Cost, complexity, less time to validate | Findings arrive later |
Not every predictive-maintenance use case requires real-time AI. Many asset-condition trends develop over weeks or months, so periodic scoring is often enough.
Integration With Utility Systems
| System | Possible Contribution |
|---|---|
| SCADA | Real-time measurements, alarms, breaker status |
| EMS | Transmission operating context |
| DMS / ADMS | Distribution network state, switching and loading context |
| OMS | Outage records, useful for failure history |
| GIS | Asset location and network topology |
| AMI, HES, MDMS | Meter-derived loading and events where relevant |
| Historian | Long-term time-series storage |
| IoT platform | Sensor data collection and device management |
| Asset management system | Asset records, work orders, maintenance history |
| Enterprise data and analytics platforms | Data integration, model development and scoring |
Not every utility uses all of these together. Integration scope depends on what exists and what the use case needs. For more on how these systems fit together, see power system automation.
Human-in-the-Loop Decision Making
AI detects patterns and provides risk signals. Engineers and maintenance teams then validate:
- Asset condition and operational context.
- Inspection results and maintenance history.
- Asset criticality and safety considerations.
- Business and resource constraints.
They decide whether action is required. AI is not an autonomous replacement for utility engineers. Engineers know about planned work, local conditions and equipment quirks that a model has not seen, and their findings improve the model over time. The same principle runs through machine learning for utility operations and asset intelligence.
Practical Utility Use Cases
| Use Case | Asset / Data | AI Role | Output | Utility Decision |
|---|---|---|---|---|
| Transformer condition monitoring | Temperature, load, DGA, alarms | Detect changing patterns | Health or anomaly signal | Review, test or inspect |
| Circuit breaker monitoring | Operation counts, timing, events | Flag abnormal behavior | Anomaly score | Prioritize breaker inspection |
| Substation equipment monitoring | Sensors, SCADA, alarms | Multivariate screening | Condition signal | Plan substation checks |
| Distribution transformer risk | Age, loading, AMI-derived data | Estimate relative risk | Risk score | Target inspections or upgrades |
| Asset failure-risk prioritization | Condition, history, criticality | Rank assets | Priority list | Allocate maintenance effort |
| Predictive inspection scheduling | Condition trends, history | Suggest timing | Inspection recommendation | Adjust inspection plan |
| Fleet-level asset comparison | Many similar assets | Compare against peers | Outlier list | Investigate outliers |
| Condition trend detection | Time-series sensor data | Detect gradual change | Trend alert | Monitor or intervene |
Hypothetical Example 1: Transformer
Hypothetical example. It describes no real utility, incident or performance figures.
Asset: Power transformer
Available data: temperature, load, oil-related condition indicators, alarms, maintenance history
Process: Baseline → Feature engineering → Model → Risk score → Engineering validation
A baseline relates the transformer’s temperature to load and ambient conditions. Features capture temperature rise per unit of load, its trend over months, and alarm frequency. The model flags that temperature behavior has drifted away from the baseline and raises the unit’s relative risk score. Engineers review the load history, recent oil results, maintenance records and sensor condition. They may confirm a real change and schedule additional testing, or find that a recent loading pattern explains it. The score prompted the investigation, and engineers made the decision.
Hypothetical Example 2: Circuit Breaker
Hypothetical example. No real equipment or results are described.
Operation history + Event data + Mechanical/condition signals → AI model → Abnormal condition → Maintenance investigation
A breaker’s operating time gradually lengthens relative to its history and to similar breakers, and its event log shows more alarms. An anomaly model flags the pattern as abnormal. A maintenance team checks the mechanism and recent operations. The finding may point to wear needing service, or to a measurement issue. Either way, the model directed attention to the right breaker sooner than a fixed schedule might have.
Hypothetical Example 3: Distribution Asset Fleet
Hypothetical example, with illustrative labels and no real data.
| Asset | Condition | Criticality | Age | Loading | Failure History | AI Risk Indicator |
|---|---|---|---|---|---|---|
| Unit A | Declining | High | Older | High | Prior fault | Elevated |
| Unit B | Stable | Medium | Mid-life | Moderate | None | Low |
| Unit C | Declining | Low | Older | Moderate | None | Moderate |
Unit A would likely be reviewed first because condition, criticality and risk all point the same way. Unit C might be monitored or scheduled later. Engineers confirm the ranking before work orders are issued.
Implementation Roadmap
- Define the business or engineering objective, such as prioritizing transformer inspections.
- Select the asset class where data and value align.
- Inventory available data, including gaps.
- Assess data quality before modeling.
- Establish a baseline of normal behavior.
- Select the analytical approach, starting simple.
- Build a pilot on a limited asset set.
- Validate against engineering knowledge and past outcomes.
- Integrate with workflow, so outputs reach planners and engineers.
- Monitor performance, including drift.
- Expand asset coverage gradually.
- Continuously improve using feedback.
Common Mistakes
- Treating AI predictions as guaranteed failures.
- Using poor-quality sensor data.
- Ignoring asset-domain knowledge.
- Training on insufficient failure examples.
- Ignoring false positives and false negatives.
- Using the wrong time horizon.
- Deploying without workflow integration.
- Ignoring model drift.
- Creating dashboards without action processes.
- Treating every anomaly as a failure.
- Ignoring cybersecurity and data governance.
Current, Emerging and Future Technology
| Technology | Current | Emerging | Future / Experimental |
|---|---|---|---|
| IoT sensors | Used on selected critical assets | Broader deployment on distribution assets | Dense, low-cost sensing everywhere (speculative) |
| Edge analytics | Limited use | Pilots | Widespread on-device analysis (speculative) |
| AI/ML | Anomaly detection and risk ranking in many pilots and some operations | Integrated asset-health models | Highly adaptive models |
| Digital twins | Planning and simulation models | Data-linked asset twins | Continuously updated twins (speculative) |
| Streaming analytics | Limited | Operational pilots | Broad real-time scoring |
| Advanced asset-health models | Health indexes | ML-enhanced indexes | Fully probabilistic, validated models |
| Explainable AI | Feature importance, simple explanations | Case-level explanations | Rich engineering-grounded explanations |
| Autonomous maintenance recommendations | Rare | Controlled pilots | Speculative, with human oversight likely retained |
Future entries are possibilities, not universal current practice.
Benefits of AI Predictive Maintenance
Potential benefits include better maintenance prioritization, earlier detection of abnormal behavior, improved asset visibility, better use of maintenance resources, fewer unnecessary inspections where appropriate, improved planning, better asset lifecycle decisions and improved engineering decision support. These are possibilities. Results vary, and no guaranteed return on investment or percentage improvement is claimed here.
Limitations
- Data availability and quality.
- Rare failures and limited labels.
- Model uncertainty and false alarms.
- Sensor limitations.
- Integration complexity.
- Cybersecurity and data governance.
- Explainability.
- Workforce skills and maintenance workflow adoption.
- Regulatory and safety considerations.
Future of AI Predictive Maintenance
Realistic developments include better IoT sensing, edge analytics, improved asset-health models, AI-assisted diagnostics, digital twins, streaming analytics, multimodal asset data, closer integration with asset management, explainable AI, risk-based maintenance and AI-assisted inspection planning. Current capability centers on anomaly detection, health scoring and risk ranking for monitored assets. Emerging work extends to integrated multi-source models. Fully autonomous maintenance is a future possibility, and critical decisions are likely to keep human oversight. For broader context, see the electric grid in 2035.
Summary
AI predictive maintenance turns sensor data into asset-health and anomaly signals, uses AI/ML to estimate failure risk, and helps rank assets for attention. Engineering validation sits between the signal and the maintenance decision, and feedback from the result improves the model.
Conclusion
AI predictive maintenance is most valuable when it connects reliable asset data and engineering expertise with useful risk signals and maintenance workflows. It does not replace traditional maintenance or engineers. It helps utilities decide where to look first, with evidence behind the decision. Starting with a clear objective, good data and a validated pilot gives the approach the best chance of delivering practical value.
Frequently Asked Questions About AI Predictive Maintenance
What is AI predictive maintenance?
AI predictive maintenance uses machine learning and related methods on sensor, asset and operational data to estimate equipment condition and maintenance or failure risk. For electric utilities, it applies to assets such as transformers and circuit breakers.
The output is a risk or health signal that supports planning. It does not guarantee when any asset will fail.
How does AI predictive maintenance work?
Utilities collect and quality-check sensor and operational data, then engineer features and build a baseline of normal behavior. An AI/ML model scores anomalies, health or risk, and assets are ranked.
Engineers validate the results, decide on maintenance, and feed outcomes back to improve the model. The cycle repeats as new data and findings arrive.
Why is AI predictive maintenance important for electric utilities?
Utility assets are costly, long-lived and critical to reliability, and many are distributed or hard to inspect. Calendar-based work can miss developing problems or service healthy equipment.
AI can help prioritize inspection and maintenance using actual condition data, supporting better planning and resource use. Its value depends on data quality and engineering validation.
What are the main components of AI predictive maintenance?
The main components are data sources and sensors, data collection and quality checks, feature engineering, a baseline of normal behavior, an AI/ML model, health or anomaly signals, failure-risk assessment, asset prioritization, engineering validation, maintenance action and a feedback loop.
Integration with asset-management and maintenance workflows turns the analysis into practical decisions.
What are the challenges of using AI for predictive maintenance?
Common challenges include missing or poor-quality sensor data, rare failures and few labeled examples, sensor drift, model drift, false positives and negatives, and limited explainability. Integration with existing systems, cybersecurity, data governance, workforce skills and workflow adoption also matter.
Utilities address these with careful baselines, time-based validation, engineering review and ongoing monitoring.
Where is AI predictive maintenance used in the electricity industry?
It is used or piloted for transformer condition monitoring, circuit breaker and switchgear monitoring, substation equipment, distribution transformer risk and fleet-level asset comparison. Some utilities also apply it to cables and auxiliary equipment where data exists.
Adoption varies by utility, asset class and data availability, and many uses remain in pilot or early deployment stages.
How does AI help predict utility asset failure risk?
AI learns patterns linking condition data, operating history and asset attributes to past abnormal conditions or failures, then scores current assets on a defined time horizon. It can rank assets by relative risk and highlight changing behavior.
Estimates carry uncertainty, depend on limited failure data, and need calibration. They guide investigation and do not predict exact failure times.
How do utilities validate AI-based predictive maintenance recommendations?
Utilities test models with time-based validation and backtesting, and review metrics such as precision, recall and false-positive rates. In operation, engineers compare flagged assets with inspection results, test data, loading history and maintenance records before acting.
Outcomes are recorded and fed back, and model performance is monitored for drift over time.

I share real stories, practical ideas and honest perspectives on business, marketing and life. This blog is a space to learn, grow and connect.


