
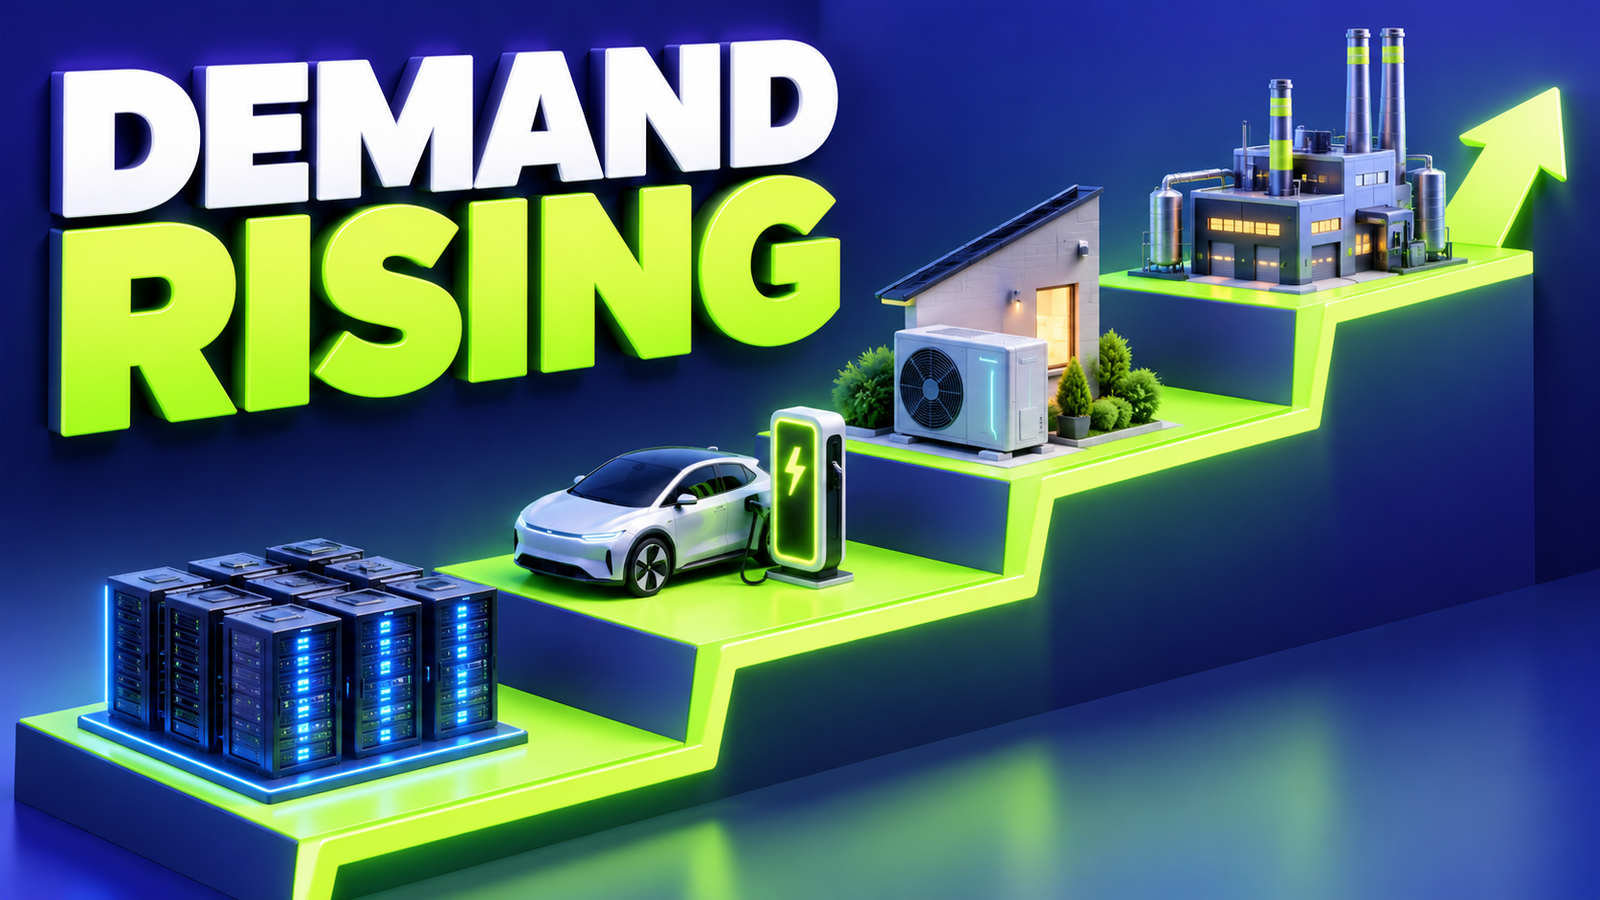
Electricity demand growth is the increase in the amount of electrical energy used, and in the power that networks must be able to deliver at peak times, as more of the economy runs on electricity. Electricity demand is increasing in many regions because of a combination of economic development, population and urban growth, digital infrastructure, electric vehicle (EV) adoption, industrial activity and the electrification of transport, buildings and industrial processes. The scale and speed of growth differ widely by region.
The International Energy Agency (IEA) reports that global electricity demand grew by about 3% in 2025 and forecasts growth of 3.6% in 2026 and 3.8% in 2027, according to its Electricity Mid-Year Update published on 23 July 2026. In its Electricity 2026 report, published in February 2026, the IEA projects average growth of 3.6% a year from 2026 to 2030, which it describes as about 50% faster than the average of the previous decade. These are forecasts, not measurements, and they carry uncertainty from weather, economics and policy. For grid planners, the more pressing question is often not the annual total but where and when new demand appears, because networks are built for peaks and for specific locations. This article explains how electricity demand growth works, what is driving it, why it matters for the grid, and how utilities plan for it. For related reading, see how utilities plan future grid capacity and grid capacity explained.
Key Takeaway
- Electricity demand growth reflects several drivers at once, including data centers, EVs, building and industrial electrification, economic growth and cooling.
- Energy consumption (kWh or MWh), peak demand (kW or MW) and installed capacity (MW or GW) are different quantities, and grids are planned around peaks and locations as well as totals.
- Growth varies sharply by country, region and sector, and forecasts carry uncertainty.
- New demand does not automatically mean the grid will fail. Outcomes depend on available capacity, timing, location and planning.
- Responses include network upgrades, flexibility, storage, demand response, better forecasting and grid modernization, each with limits.
What Is Electricity Demand Growth?
Electricity demand growth is the increase over time in electricity consumption and in the peak power that the electrical system must supply, driven by changes in population, economic activity, technology and the sources of energy people use.
Several related terms are often confused. The table separates them.
| Term | Meaning | Common Unit | Why It Matters for Grid Planning |
|---|---|---|---|
| Electricity consumption | Total energy used over a period | kWh, MWh, GWh, TWh | Drives generation energy needs and fuel or resource planning |
| Peak demand | Highest power drawn in a period | kW, MW, GW | Sets the capacity needed in networks and generation |
| Average demand | Energy divided by time | kW, MW | Shows typical use and helps compute load factor |
| Load factor | Average demand divided by peak demand | Ratio or percentage | Shows how peaky demand is |
| Load profile | Demand over time, such as across a day | kW or MW over time | Reveals when peaks occur and how long they last |
| Installed capacity | Maximum output of generation or the rating of network equipment | MW, GW | What the system can supply or carry, not what is used |
| Demand forecast | An estimate of future consumption or peak demand | Same as above, with a time horizon | Guides investment, and is uncertain |
Annual energy consumption, peak demand, load factor and load profiles each describe a different aspect of electricity use. Demand can grow in total energy while peaks barely change, or peaks can rise sharply while annual energy grows modestly. Planning must look at both. Growth can also be long-term and structural, such as industrial expansion, or short-term and seasonal, such as heat-driven cooling peaks.
How Does Electricity Demand Growth Work?
Demand grows when more people, buildings, vehicles and machines use electricity, or when existing uses shift to electricity from other fuels. Consumer behavior, equipment efficiency, population, industrial production and technology all affect it. Efficiency gains can offset growth in some applications, so net growth depends on the balance.
Individual loads combine into a system load profile. Each household, building or factory has its own pattern, and the grid sees their sum. Peak demand develops when many loads happen to coincide, for example on a hot evening when cooling, cooking and lighting overlap. Because the loads do not all peak together, the system peak is lower than the sum of individual peaks, a relationship called diversity. New technologies can change diversity. EV charging and electric heating can be highly coincident if many users start at the same time of day.
The following example is hypothetical and uses invented numbers for illustration.
A distribution feeder serves a neighborhood with a peak demand of 2 MW and an average demand of 1 MW, so its load factor is 0.5. Over a year it supplies about 1 MW × 8,760 hours = 8,760 MWh. Now suppose EV charging is added, with an average demand of 0.1 MW but a coincident evening peak of 0.5 MW.
- Annual energy rises by about 0.1 MW × 8,760 h = 876 MWh, or 10%.
- Evening peak rises by up to 0.5 MW, or 25% of the original 2 MW, if the charging coincides with the existing peak.
Energy grows by 10% but the peak by up to 25%. Equipment sized for peaks, such as transformers and feeders, feels the larger number. This is why annual consumption figures alone can understate infrastructure needs.
The Main Drivers of Increasing Electricity Demand
Several drivers act at once, and they do not all grow at the same rate or affect peak demand equally. The IEA’s Electricity 2026 report lists rising consumption from industry, electric vehicles, air conditioning and data centres among the main sources of growth.
AI Data Centers, Cloud Computing and Digital Infrastructure
Mechanism. Computing and data storage use electricity, and AI training and inference run on power-dense hardware. Cooling and power conversion add to facility demand.
Evidence. The IEA’s Energy and AI report (April 2025) estimates that data centres used around 415 TWh in 2024, about 1.5% of global electricity consumption, and projects that consumption more than doubles to around 945 TWh by 2030 in its base case. It also finds that data centre consumption has grown about 12% a year since 2017, and that in the United States data centres account for nearly half of demand growth to 2030. The IEA stresses that data centre impacts are more pronounced locally than globally, because facilities are geographically concentrated.
Load characteristics. Data center loads are high, continuous and located in clusters, and some AI workloads can ramp quickly.
Grid implications. Large single connections can require new substations, transmission reinforcement and transformers. See how AI data centers affect electricity demand and whether the grid can keep up with AI data center demand.
Limiting factors. Hardware efficiency, workload growth, cooling methods, project cancellations, grid connection queues and site availability all change the outcome, and the IEA presents scenarios because uncertainty is wide.
Electric Vehicles and EV Charging Networks
Mechanism. EVs replace fuel with electricity, and charging adds load at homes, workplaces and public sites.
Evidence. The IEA’s Global EV Outlook 2026 reports that global electric car sales grew by 20% in 2025 to exceed 20 million, about a quarter of all new cars sold, and expects sales to reach 23 million in 2026, around 28% of car sales. It also notes that first-quarter 2026 sales fell 8% compared with the same period in 2025 after policy changes in China and the United States, a reminder that adoption is uneven.
Load characteristics. Home charging is often in the evening and can be shifted, while public fast charging can create high, short peaks at specific sites. Total energy use per vehicle is modest compared with a household’s total, but coincident charging can raise local peaks.
Grid implications. The main constraint is typically local distribution capacity, including transformers and feeders, more than total generation. See transformer capacity and electrification.
Limiting factors. Adoption rate, charging behavior, managed charging and tariffs, vehicle efficiency, and the share of charging done at off-peak times.
Electrification of Buildings: Heat Pumps and Electric Appliances
Mechanism. Heat pumps, induction cooking and electric water heating replace gas, oil or other fuels. Heat pumps are efficient, so they deliver more heat per unit of electricity than resistance heating.
Load characteristics. Heating demand is strongly seasonal and weather-driven. In cold climates, widespread electric heating can raise winter peaks significantly, and the effect depends on building efficiency, heat pump performance in cold conditions and backup heating.
Grid implications. Winter peaks can shift network planning from summer to winter in some regions, and distribution upgrades may be needed in neighborhoods with concentrated adoption.
Limiting factors. Insulation and efficiency programs, equipment costs, building stock, thermal storage and smart controls.
Industrial Expansion, Manufacturing and Process Electrification
Mechanism. Industry grows in some regions, and some processes switch from fuel to electricity, such as electric furnaces, industrial heat pumps and electrified low-temperature heat.
Load characteristics. Industrial loads are often large, steady and predictable, with high load factors, though some processes are flexible.
Grid implications. Large industrial connections need transmission-level or substation capacity, and their timing is project-driven. The IEA’s mid-year update notes that industrial growth and electrification are among drivers of the faster demand growth it expects.
Limiting factors. Industrial output, energy prices, technology readiness and policy.
Population Growth, Urbanization and Commercial Development
Mechanism. More people, more homes and more commercial space bring more electricity use, especially where rising incomes bring more appliances.
Load characteristics. Residential and commercial loads follow daily and seasonal patterns and have significant diversity.
Grid implications. Urban growth requires new feeders and substations, and growth may be uneven, with fast expansion in some districts and decline in others.
Limiting factors. Building efficiency standards, construction rates and demographic change.
Economic Growth and Rising Living Standards
Mechanism. Higher incomes tend to bring more appliances, air conditioning, services and manufacturing. The IEA notes that, outside crisis periods, electricity demand has begun to grow faster than the global economy for the first time in three decades, in its Electricity 2026 analysis.
Regional differences. The IEA expects emerging economies to account for nearly 80% of additional consumption through 2030, with China alone responsible for about half of global growth. Its mid-year update forecasts 2026 growth of 5.5% in China and 7% in India, and close to 2% in both the United States and the European Union. Growth is therefore far from uniform.
Cooling Demand, Air Conditioning and Climate-Related Peaks
Mechanism. Air conditioning demand rises with temperature, income and building stock. Heatwaves can push peak demand to new highs even when annual consumption changes little.
Load characteristics. Cooling creates strong afternoon and early evening peaks in hot regions. The IEA’s mid-year update cautions that a stronger-than-expected El Niño in 2026 could boost demand further by raising cooling needs, which also shows how weather adds uncertainty to forecasts.
Grid implications. Cooling peaks stress distribution equipment and generation adequacy at specific hours, and high temperatures also reduce equipment capacity.
Limiting factors. Equipment efficiency, building design, thermal storage and demand response.
Hydrogen Production and Other Emerging Electricity-Intensive Uses
Electrolytic hydrogen production, some carbon removal technologies and new manufacturing such as batteries and semiconductors can be electricity-intensive. Their contribution to demand is currently small compared with the drivers above and is highly uncertain, because it depends on project decisions, costs and policy. They matter mainly for specific locations where large projects connect, and no global figure is claimed here.
Electricity Demand Growth Across Different Sectors
| Sector | Major Demand Drivers | Typical Load Characteristics | Planning Concerns | Possible Demand-Management Approaches |
|---|---|---|---|---|
| Residential | Population, appliances, cooling, heat pumps, home EV charging | Morning and evening peaks, strong seasonality | Distribution transformers and feeders, winter or summer peaks | Time-of-use tariffs, managed charging, efficiency programs |
| Commercial | Floor area growth, cooling, lighting, digital equipment | Business-hours demand, daytime peaks | Feeder and substation capacity in growing districts | Building controls, demand response, on-site storage |
| Industrial | Output growth, process electrification | Large, steady, high load factor, some flexible processes | Large connections, transmission capacity, reliability needs | Interruptible or flexible load programs, process scheduling |
| Transportation | EV adoption, charging networks, electrified fleets | Evening home peaks, short high peaks at fast chargers | Local network capacity, site-specific upgrades | Managed charging, smart tariffs, charging hub design |
| Digital infrastructure | Data centers, AI workloads, telecoms | High, continuous, clustered, sometimes fast-changing | Large connections, substation and transmission capacity, timing of energization | Flexible computing, on-site storage, phased connection |
Why Electricity Demand Growth Matters for the Electric Grid
Rising demand affects every part of the power system:
- Generation adequacy and resource planning: enough energy and capacity must be available at peak times.
- Transmission capacity and congestion: power must be moved from where it is generated to where demand grows.
- Distribution feeders and substations: local growth can exceed existing ratings.
- Power transformers and switchgear: equipment capacity limits connections and has long lead times. See transformer capacity for data centers.
- Connections for large new loads: studies, upgrades and construction determine connection timelines.
- Voltage management and power quality: new loads change voltage profiles and may add harmonics.
- Reliability and capital planning: investments, project schedules and customer connection timelines all have to be coordinated.
New demand does not automatically mean the grid will fail. The outcome depends on available capacity, the location and timing of new loads, network constraints, generation and transmission development, and utility planning. Networks often have spare capacity in some places and constraints in others, so the same growth can be easy to serve in one area and difficult in another. The IEA’s Electricity 2026 analysis emphasizes the need for fast and efficient expansion of grids and system flexibility as demand grows.
What Are the Main Challenges of Electricity Demand Growth?
- Uncertain forecasts. Adoption rates, project decisions, weather and policy are hard to predict, so planners work with ranges and scenarios.
- Local bottlenecks and uneven growth. Demand concentrates in particular areas, such as data center clusters, so local constraints can bind long before system-wide shortages.
- Long procurement and construction timelines. Large transformers, switchgear, lines and substations take time to procure and build, and demand can arrive faster than infrastructure.
- Peak demand and seasonal variability. Equipment must handle the highest hours, which may occur on only a few days a year.
- Permitting, land, investment and coordination. New lines and substations need approvals, land and funding, and developers and utilities need to align schedules.
- Integration of variable renewables. Wind and solar output varies, so supply and demand must be balanced with flexibility and storage.
- Affordability, tariff design and cost allocation. Network investment must be paid for, and decisions about who pays are contested. The IEA notes in its Electricity 2026 highlights that affordability is a key concern, with household prices rising faster than incomes in many countries since 2019.
- Balancing reliability, decarbonization and flexibility. These goals can pull in different directions, and trade-offs differ by region.
How Utilities Forecast Future Electricity Demand
Forecasting estimates three different things: annual energy use, peak demand and localized network requirements. They need different methods and data. Annual energy forecasts rely on economic and population trends. Peak forecasts need weather and load-shape information. Local network forecasts need to know where new loads will connect.
| Input | What It Helps Estimate | Limitations |
|---|---|---|
| Historical load and consumption data | Baseline energy and peak patterns, growth trends | Past patterns may not hold as new loads arrive |
| Weather and seasonal patterns | Peak demand sensitivity, cooling and heating loads | Extreme weather is rare and hard to model |
| Population, economic and industrial forecasts | Long-term energy growth and regional differences | Forecasts themselves are uncertain |
| EV adoption and charging behavior | Added energy and coincident peaks | Charging timing depends on tariffs and user behavior |
| Data center and large-customer connection requests | Large step increases at specific points | Requests can be speculative, duplicated or withdrawn |
| Distributed energy resources and behind-the-meter generation | Net load shape and midday reductions | Output and operation are not always visible to the utility |
| Scenario planning and sensitivity analysis | Range of plausible outcomes | Scenarios are not predictions and need judgment |
AI and machine learning can improve short-term and local forecasting by learning relationships between demand, weather and customer behavior. See AI for electricity load forecasting. These methods help, but they depend on data quality and do not remove the uncertainty about new, unprecedented loads.
How Utilities and Grid Planners Respond to Rising Demand
No single response fits every case. Common approaches, and their limits, are:
- Generation and transmission planning. Adds supply and transfer capacity. Needs long lead times, siting and funding.
- Substation, feeder and transformer upgrades. Add physical capacity where constraints are found. Costly and slow, but effective for lasting growth.
- Grid modernization and automation. Better switching, monitoring and control can use existing capacity more effectively. They do not create capacity beyond equipment ratings.
- Advanced metering infrastructure (AMI). Provides interval data that improves visibility of loads and supports tariffs and analytics. AMI does not itself add physical capacity.
- Smart-grid monitoring and operational visibility. Shows loading and conditions so operators can act earlier. See key components of a smart grid.
- Demand response and flexible load programs. Shift or reduce peak demand. Effectiveness depends on customer participation and may vary.
- EV managed charging and time-of-use incentives. Move charging to off-peak times. Results depend on design and user response.
- Battery storage and other flexibility. Shift energy in time and can defer some upgrades. Costs, duration and siting matter.
- Distributed generation and microgrids. Can serve local loads and add resilience in suitable places. They add operational complexity.
- AI/ML-based forecasting and analytics. Improve estimates and spot constrained assets. They support planning, but they do not create capacity.
Utilities typically combine these, using flexibility and monitoring to defer or right-size physical upgrades, and building capacity where growth is firm and lasting.
Electricity Demand Growth and the Energy Transition
Electrification can raise electricity use while reducing direct fossil fuel use in transport, buildings and industry. For example, an EV or heat pump may use more electricity but displace gasoline or gas use. Efficient electric technologies can use less total energy than the fuels they replace.
Whether this reduces emissions depends on how the electricity is generated, how efficient the new equipment is and how the wider energy system changes. Increased electricity consumption does not automatically reduce emissions. The IEA’s Electricity 2026 highlights note that global power sector emissions were flat in 2025 and are forecast to plateau through 2030 as renewables and nuclear take a growing share of generation, which shows the link to the generation mix. The IEA’s mid-year update also stresses that storage and grid flexibility will be critical as renewables grow. Energy efficiency, renewable generation, storage and flexibility all work together to keep supply reliable while demand grows.
Illustrative Planning Scenario
This scenario is hypothetical. It does not describe a real utility or project, and all numbers are invented.
A utility area faces three new loads: an EV charging hub, a commercial development and an industrial customer.
- Identify expected new loads. Planners collect connection requests: an EV hub with six 150 kW chargers (900 kW nameplate), a commercial development with an expected peak of 1,200 kW, and an industrial plant with an expected peak of 2,000 kW.
- Estimate annual energy and peak demand separately. For the hub, assume a coincidence factor of 0.5, giving a 450 kW peak, and a load factor of 0.25. For the commercial development, assume a load factor of 0.5. For the industrial plant, assume a load factor of 0.8.
- EV hub energy: 450 kW × 0.25 × 8,760 h ≈ 985 MWh a year.
- Commercial energy: 1,200 kW × 0.5 × 8,760 h = 5,256 MWh a year.
- Industrial energy: 2,000 kW × 0.8 × 8,760 h = 14,016 MWh a year.
- Total energy ≈ 20,257 MWh a year (about 20.3 GWh).
- Sum of peaks = 450 + 1,200 + 2,000 = 3,650 kW. Assuming 90% coincidence, combined peak ≈ 3,285 kW, which at a power factor of 0.95 is about 3,458 kVA.
- Assess when and where loads will connect. The hub and commercial development connect on one feeder in year one, and the plant connects at a substation in year two.
- Review feeder, substation and transformer capacity. Suppose the feeder has 2,500 kVA of spare capacity. The combined peak of about 3,458 kVA exceeds it by roughly 960 kVA, so a constraint appears even though annual energy looks modest relative to the system.
- Evaluate flexibility and upgrades. Options include managed charging at the hub to reduce its coincident peak, commercial demand response, a battery at the hub, moving the plant to a different feeder or substation, and reinforcing the feeder or adding a transformer.
- Compare scenarios and monitor. Planners compare a high-growth case, where all loads connect on schedule, with a lower case where the hub is delayed, then monitor actual demand after connection and update the forecast.
The scenario shows that peak and energy differ, that timing and location drive constraints, and that flexibility and upgrades can be combined. Real studies would use detailed network models and measured data.
Practical Checklist for Grid Planners and Energy Professionals
- Demand data quality: verify meter data, customer mapping and historical load records.
- Peak and energy forecasts: forecast both, separately.
- Load location and connection timing: map new loads to feeders and substations, with dates.
- Sector-specific assumptions: use appropriate load shapes and coincidence for EVs, heating, cooling and data centers.
- Equipment and network capacity: check transformers, feeders, substations and thermal limits. See transformer loading.
- Forecast uncertainty: use scenarios and ranges, and treat speculative requests with care.
- Flexibility options: assess demand response, managed charging and storage.
- Upgrade dependencies and project timelines: include procurement, permitting and construction lead times.
- Reliability and affordability: weigh cost, reliability and equity.
- Ongoing monitoring and forecast updates: compare actual with forecast and revise.
Future Outlook: What Will Shape Electricity Demand Next?
Near term. The IEA expects global demand growth of 3.6% in 2026 and 3.8% in 2027, with global consumption rising from about 28,600 TWh in 2025 to about 30,700 TWh in 2027, according to its July 2026 mid-year update. Industry, cooling, EVs, appliances and data centres are the main sources. Weather and energy-market volatility add short-term uncertainty.
Medium term. The IEA projects average growth of 3.6% a year to 2030 in Electricity 2026, and data centre consumption roughly doubling by 2030 in its Energy and AI base case. EV sales are projected to keep rising, with the IEA’s Global EV Outlook 2026 showing a path to around half of car sales by 2035 in its exploratory scenarios, though regional policy changes can slow growth.
Longer term. Industrial and building electrification, economic development in emerging economies, efficiency gains and flexible loads will shape demand after 2030. The IEA notes that uncertainty widens after 2030. Possibilities include more flexible data centers, widespread managed charging and growth in electricity-intensive industries, but these remain possibilities, not forecasts. All projections are scenarios, and actual demand will depend on technology, policy, prices and weather.
Conclusion
Electricity demand growth is a combined energy, capacity, location, timing and infrastructure-planning challenge. Total consumption matters for supply, but peaks, local constraints and lead times determine whether the grid can connect new loads when they are needed. Meeting it well depends on accurate forecasting, timely grid investment, efficiency, flexibility and coordination between utilities and customers. For readers interested in what comes next, the practical next step is to look at how networks are assessed and upgraded, starting with grid capacity planning and the role of grid modernization in using existing infrastructure more effectively.
Frequently Asked Questions About Electricity Demand Growth
What is electricity demand growth?
Electricity demand growth is the increase over time in electricity consumption and in the peak power the system must supply. It results from population and economic growth, digital infrastructure, EV adoption, industrial activity and electrification of transport, buildings and industry.
Its scale and speed differ by region, sector and year.
How does electricity demand growth work?
Changes in equipment, behavior, population and production alter how much electricity people use and when. Individual loads add up into a system profile, and peaks occur when many loads coincide.
Peaks and local concentrations can grow faster than annual totals, which is why planners look at both energy and power.
Why is electricity demand growth important?
It affects generation adequacy, transmission and distribution capacity, equipment procurement, connection timelines, reliability and affordability. Utilities must plan and invest ahead of demand, and forecasts are uncertain.
Growth does not automatically mean grid failure. Outcomes depend on available capacity, location, timing and planning.
What are the main components of electricity demand growth?
Main drivers are data centers and digital infrastructure, EVs and charging, building electrification, industrial expansion, population and urbanization, economic growth and cooling. Emerging uses such as hydrogen production add uncertain demand.
They differ in size, load shape and timing, and not all grow at the same rate.
What are the challenges of electricity demand growth?
Challenges include forecast uncertainty, local bottlenecks, long equipment and construction lead times, peak and seasonal variability, permitting and funding, renewable integration, affordability and balancing reliability with decarbonization.
Their weight differs by region and utility.
Where is electricity demand growth used?
The concept is used in utility and grid planning, resource adequacy studies, transmission and distribution investment, connection studies for large customers, energy policy and infrastructure development.
Planners, regulators, utilities and industrial customers all use demand growth analysis.
How do data centers affect electricity demand?
Data centers add large, continuous loads concentrated in a few locations. The IEA estimates they used around 1.5% of global electricity in 2024 and projects consumption to more than double by 2030 in its base case, though local effects are far greater than global ones.
Projections are uncertain and depend on workloads and efficiency.
How do EVs affect peak electricity demand?
EV charging adds energy use, but its effect on peaks depends on when charging happens. Uncoordinated evening charging can raise local peaks, while managed charging and time-of-use tariffs can shift load to off-peak times.
The main constraint is usually local distribution capacity.
What is the difference between electricity consumption and peak demand?
Consumption is the energy used over a period, in kWh or MWh. Peak demand is the highest power drawn, in kW or MW. Grids must be able to supply the peak, so they are sized for it.
Consumption can rise modestly while peaks rise sharply, and the reverse can also happen.
How do utilities forecast future electricity demand?
Utilities combine historical load data, weather, economic and population forecasts, EV and heat pump adoption, large-customer requests and distributed generation, using scenarios and uncertainty ranges.
They forecast annual energy, peak demand and local network needs separately. Forecasts remain uncertain.
Can smart grids help manage rising electricity demand?
Smart grid tools can improve visibility, enable demand response and managed charging, and help use existing capacity more effectively. They do not by themselves add physical capacity.
Where growth is lasting, network upgrades are usually still needed alongside smart grid measures.
Sources and Further Reading
- International Energy Agency, Electricity 2026: Analysis and forecast to 2030, February 2026.
- International Energy Agency, Electricity Mid-Year Update, 23 July 2026.
- International Energy Agency, Energy and AI, Executive Summary, April 2025.
- International Energy Agency, Global EV Outlook 2026, Executive Summary.
Figures are as reported by these sources on the dates given and are forecasts or scenarios where stated. They may be revised in later editions.

I share real stories, practical ideas and honest perspectives on business, marketing and life. This blog is a space to learn, grow and connect.


