
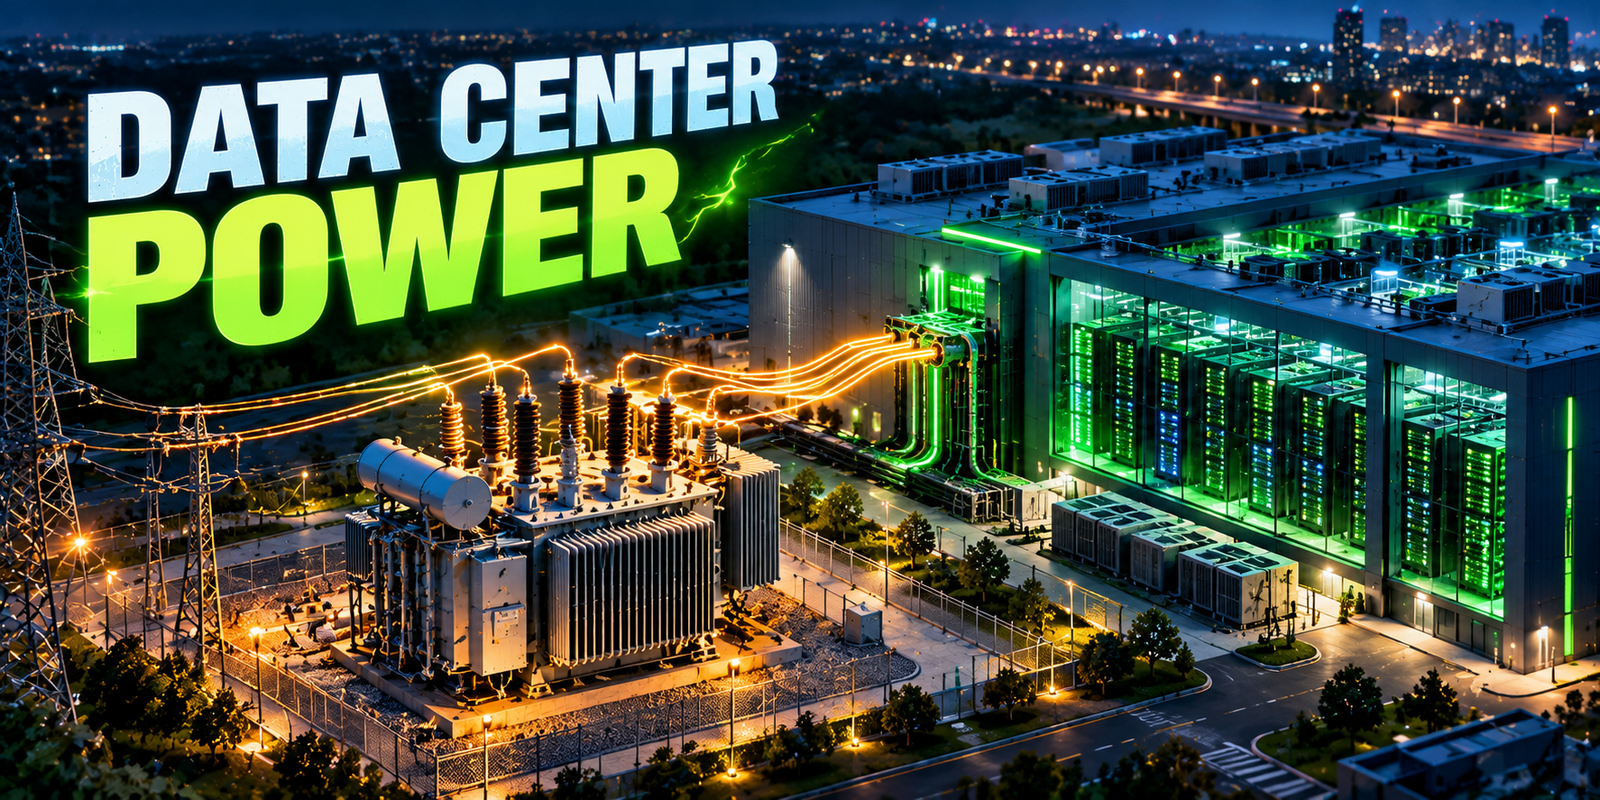
Transformer capacity for data centers determines how much electrical power a facility can actually receive and distribute, and it is becoming a central planning issue as computing sites grow in size and density. A data center depends on transformers at several points, from the utility connection down to the voltage levels that feed power distribution units and racks. If transformer capacity is too small, the facility cannot support its computing load or its growth. If it is far too large, capital is tied up and efficiency at light load can suffer.
The challenge is that data center demand is not like that of an ordinary building. It is high, continuous, tightly tied to computing activity and increasingly concentrated in dense racks that run AI and other intensive workloads. Redundancy requirements add further capacity, and cooling adds load on top of the computing equipment. This article explains how transformer capacity relates to data center power demand, how to reason about sizing with illustrative calculations, how redundancy and thermal limits shape installed capacity, and how monitoring and analytics support planning. It describes general principles only. Real sizing must be validated by qualified electrical engineers using site-specific forecasts, utility requirements, manufacturer data and applicable codes and standards. For related background, see transformer loading and why transformers are critical to the electric grid.
Key Takeaway
- Transformer ratings are in apparent power (kVA or MVA), while computing and cooling loads are mostly described in real power (kW or MW). Power factor links them.
- Total facility demand is higher than IT demand because it includes cooling, power losses, lighting and auxiliary systems.
- Peak demand, growth, redundancy and thermal limits all affect how much transformer capacity is installed and how it is operated.
- AI workloads and dense racks can change load size and behavior, so planning should use scenarios.
- Monitoring and forecasting support planning but do not replace engineering design and validation.
- Utility connection capacity and lead times often shape what is possible, not just transformer ratings.
What Transformer Capacity Means in Electrical Power Systems
Transformer capacity is the apparent power, in kVA or MVA, that a transformer is designed to deliver under specified conditions without exceeding its temperature and stress limits.
Capacity is set by design and tested for stated conditions such as ambient temperature, cooling mode and temperature rise limits. Some transformers have multiple ratings for different cooling stages. Capacity is a property of the equipment, while loading is how much of that capacity is being used at a given moment. A transformer’s usable capacity in practice also depends on ambient conditions, cooling condition, harmonics and how long loads last, which is why the nameplate figure is a starting point and not the whole story. The loading side is covered in more detail in transformer loading explained.
How Transformers Supply Data Centers and Computing Infrastructure
Power typically reaches a data center through several transformation steps. Utility supply arrives at high or medium voltage and is stepped down by one or more transformers to the facility’s distribution voltage. Further transformers, sometimes integrated into power distribution units, reduce voltage to levels used by equipment. Between these steps sit switchgear, uninterruptible power supply (UPS) systems and often backup generators.
Utility connection
Supply from the grid at medium or high voltage.
Step-down transformer
Reduces to facility distribution voltage.
Switchgear
Protects and distributes power, with generator connection.
UPS systems
Provide conditioned power and ride-through.
Distribution transformers or PDUs
Provide final voltage and distribution.
Racks and IT equipment
The computing load.
Cooling plant and building systems connect at similar points. Each transformer in the chain must be sized for the load it serves, and the arrangement determines how a failure or maintenance outage affects the facility. Details vary between designs. For the grid-side role of such equipment, see distribution transformers explained.
Why Data Center Power Demand Differs From Conventional Commercial Buildings
Compared with a typical office or retail building, data centers differ in several ways that matter for transformer capacity:
- High and continuous load: computing equipment runs around the clock, so load factor can be high and there is little overnight relief for cooling the transformer.
- High power density: a large amount of power is concentrated in a small footprint.
- Cooling as a major load: removing the heat from computing equipment takes substantial electrical power.
- Redundancy: backup paths mean installed capacity exceeds the load actually served.
- Power quality sensitivity: equipment is sensitive to voltage disturbances, which drives protection and conditioning.
- Rapid growth: facilities are often built in phases, with load growing as halls fill.
A commercial building’s load usually follows occupancy and weather, while a data center’s follows computing activity and, for the cooling portion, weather and operating mode.
AI Workloads, GPU Clusters and High-Density Racks
AI training and inference often use clusters of graphics processing units (GPUs) or other accelerators. Compared with traditional server racks, accelerator racks can draw considerably more power per rack, which concentrates demand and heat. Specific figures vary widely by hardware and design, so none are stated here.
Implications for electrical planning include:
- Higher demand per rack and per hall, which raises the capacity needed at every level of distribution.
- Changing load shapes. Some AI workloads can ramp up and down quickly, and many accelerators working in step can produce rapid swings in demand, which stress power equipment and the upstream grid connection differently from steady loads.
- Greater cooling demand, including liquid cooling in some designs.
- Uncertainty in growth, because hardware generations and workloads change quickly.
Because of this uncertainty, capacity planning typically uses scenarios and leaves room for staged expansion rather than a single forecast.
kVA, MVA, kW, MW and Power Factor
Transformers are rated in apparent power, kVA or MVA. Equipment loads are usually described in real power, kW or MW, which is the power that does useful work. The two are related by power factor, the ratio of real to apparent power:
Apparent power (kVA) = Real power (kW) ÷ Power factor
Real power in kW is not the same as apparent power in kVA, and sizing a transformer from kW alone can understate the loading. Modern data center power supplies often operate at high power factor, but the figure at the transformer depends on the whole load, including cooling motors and any harmonic content, and so must be established from equipment data and measurement.
For three-phase systems, apparent power relates to voltage and current by:
S (kVA) = √3 × V (line-to-line, volts) × I (line current, amperes) ÷ 1,000
This assumes a balanced three-phase load. Real sizing also depends on system voltage, current, power factor, the expected load profile, equipment characteristics and applicable design requirements.
IT Load vs Total Facility Load
IT demand is the power consumed by servers, storage and networking equipment. Total facility demand is higher because it includes everything else the site needs. The table summarizes typical components. The relative sizes vary by design, climate and efficiency measures.
| Load Component | What It Includes | Planning Consideration |
|---|---|---|
| IT equipment | Servers, accelerators, storage and network gear | Main driver of demand and growth |
| Cooling | Chillers, pumps, fans, air handlers, liquid-cooling equipment | Varies with IT load, climate and cooling design |
| UPS and power distribution losses | Conversion and distribution losses in UPS, PDUs, transformers and cabling | Losses add to demand and generate heat |
| Lighting | Interior and exterior lighting | Usually small but part of total demand |
| Controls and monitoring | Building and power management systems | Small load, important for operations |
| Auxiliary systems | Security, fire protection, ventilation, office areas | Include in total demand estimates |
The overall ratio between total facility power and IT power is often summarized as power usage effectiveness (PUE). Its value depends on the facility, and no typical value is claimed here.
Estimating Transformer Capacity Requirements
All numbers in the examples below are hypothetical and show the method only. They are not engineering recommendations for any real site.
Example 1: Estimating Facility Demand From IT Load
Assumptions: an IT load of 2,000 kW, cooling of 600 kW, UPS and distribution losses of 120 kW, and lighting and auxiliary systems of 80 kW, all at the expected operating point. Power factor at the transformer is assumed to be 0.95.
Total facility demand = 2,000 + 600 + 120 + 80 = 2,800 kW
Apparent power = 2,800 kW ÷ 0.95 ≈ 2,947 kVA
In this illustration, total demand is 40% higher than IT demand (2,800 ÷ 2,000 = 1.4), and the transformer must cover about 2.95 MVA of apparent power, not 2,000 kW.
Line current at an assumed 480 V line-to-line, with a balanced load:
I = 2,947,000 VA ÷ (1.732 × 480 V) ≈ 3,545 A
Such high currents at low voltage illustrate why large facilities often use medium-voltage distribution and several smaller transformers, and why design details matter.
Example 2: Comparing Capacity With Demand and Planned Growth
Assumptions: the same 2,947 kVA initial demand, a hypothetical 20% growth allowance, and a hypothetical transformer rated 4,000 kVA.
Initial loading = 2,947 ÷ 4,000 ≈ 74%
Demand with growth = 2,947 × 1.2 ≈ 3,537 kVA
Loading with growth = 3,537 ÷ 4,000 ≈ 88%
This shows how loading rises as growth arrives. Whether 88% continuous loading is acceptable depends on the transformer’s design, cooling, ambient temperature, harmonics and the applicable loading guide and manufacturer requirements. It cannot be judged from the percentage alone.
Example 3: How Redundancy Changes Installed Capacity
Assumptions: a critical load of 3,000 kVA and transformers rated 2,000 kVA each.
- N: the number of units needed to carry the load, which is two (4,000 kVA installed, each loaded to 75% of rating when sharing equally).
- N+1: one extra unit, giving three units (6,000 kVA installed). Normally each carries 1,000 kVA (50%). If one fails, the remaining two carry 1,500 kVA each (75%).
- 2N: two fully independent systems, each able to carry the full 3,000 kVA. Total installed capacity is at least 6,000 kVA, and either system can carry the full load alone.
Redundancy increases installed capacity well above the load, and it also changes operating strategy. Under N+1, transformers may run at modest loading normally and at higher loading during a failure or maintenance, so the thermal assessment must cover those conditions, not only normal operation.
| Scenario | Assumptions | Calculation Approach | Key Planning Consideration |
|---|---|---|---|
| Initial sizing | 2,000 kW IT, 800 kW overhead, 0.95 power factor | Add components, divide by power factor | Total demand, not IT demand, drives capacity |
| Growth planning | 20% growth, 4,000 kVA transformer | Scale demand, divide by rating | Loading rises with growth, so thermal limits matter |
| N+1 redundancy | 3,000 kVA load, three 2,000 kVA units | Compare loading with all units and with one unit out | Post-failure loading and thermal behavior |
Transformer Capacity Planning Factors for Data Centers
Sizing is not a single calculation. Several factors interact, and a decision on one often changes another. The table summarizes the main factors and what planners typically check. It describes general considerations only, and the weight of each factor differs between sites.
| Planning Factor | How It Affects Capacity | What to Check |
|---|---|---|
| Expected demand | Sets the baseline kVA the transformer must serve | Total facility demand by component, converted with a realistic power factor |
| Growth allowance | Adds headroom for later phases and denser racks | Phased scenarios, hardware roadmaps and when each phase is energized |
| Redundancy | Raises installed capacity and changes loading after a failure | Normal, maintenance and failure-case loading under N, N+1 or 2N |
| Ambient conditions | Hot or poorly ventilated locations reduce cooling margin | Site temperature range, room ventilation and reliability of cooling equipment |
| Power quality | Harmonics and low power factor increase heating and required kVA | Harmonic content, power factor and manufacturer guidance on harmonic loading |
| Utility constraints | Upstream capacity and timing can limit what is usable | Connection studies, substation and feeder capacity, energization dates and lead times |
| Maintainability | Access, spares and outage options affect how capacity can be used in practice | Ability to isolate a unit, spare strategy, testing access and replacement time |
Taken together, these factors explain why two sites with the same IT load can need different transformer arrangements. A site with strict redundancy, a hot climate and a constrained utility connection will often need more installed capacity, closer thermal assessment and a longer schedule than a site with more relaxed conditions. Qualified engineers should weigh the factors against the site’s availability objectives, applicable standards and the manufacturer’s data.
Peak Demand, Average Demand, Load Profiles and Utilization
Transformers are sized for peak demand, but their heating also reflects how long the load lasts. A data center’s load profile may be flat and high for IT equipment, with cooling following weather and workload. Key terms are:
- Peak demand: the highest demand in a period.
- Average demand: typical demand over time.
- Utilization: the share of installed capacity actually used.
- Load growth: how demand rises as capacity is filled.
Facilities often have a gap between the capacity installed for the final build-out and the load in early years. Low early utilization can reduce efficiency of some equipment, and rapid fill can bring loading toward design limits sooner than expected. Planning should use realistic ramp-up scenarios.
Redundancy and Resilience: N, N+1 and 2N
Data centers use redundancy to keep running during equipment failures and maintenance. Common concepts are:
- N: only the capacity needed to carry the load, with no spare.
- N+1: the needed capacity plus one extra unit.
- 2N: two complete independent systems.
Higher redundancy raises installed transformer capacity and cost, and it adds switchgear and cabling. It also affects how loads are shared, how maintenance is carried out without interrupting service, and how much loading each transformer sees after a failure. Redundancy at one level does not guarantee overall resilience if upstream utility supply or other shared components remain single points of failure. Required redundancy depends on the facility’s availability objectives and design standards.
Transformer Loading, Thermal Limits, Ambient Temperature and Insulation Ageing
Loading produces losses, which raise temperatures. Sustained high loading, high ambient temperature, poor cooling and harmonics all push temperatures up, and elevated temperature accelerates insulation ageing. The actual effect depends on equipment design and operating conditions.
Data centers present a particular case: continuous high loading means transformers may have little time to cool, and the facility may sit in a hot climate or a warm equipment room. Cooling equipment on the transformer, such as fans, must be kept working, and loading under failure scenarios must be assessed. Thermal limits, permissible loading and durations must come from the manufacturer, applicable loading guides and engineering assessment. No universal loading limit exists, and no safe overload percentage or duration is given here. For the thermal side, see transformer loading and what causes transformer failures.
Utility Interconnection, Upstream Grid Capacity and Lead Times
Transformer capacity inside a site is only part of the picture. The facility must also be connected to a grid that can supply the load. Upstream limits can include the capacity of local substations, feeders and transmission, and the time needed to build new connections or reinforce the network. Connection requests for large loads are typically studied by the utility, and the process, timing and conditions depend on the jurisdiction and the utility.
Large transformers can also have long lead times, and supply conditions vary, so ordering and delivery schedules should be considered early in planning. Some operators plan phased energization, with the facility’s power demand rising in steps as upstream capacity and equipment become available. Early engagement between data center developers and utilities helps align schedules. See transformers in the electric grid for how capacity is planned on the utility side, and how power moves through generation, transmission and distribution networks for the wider delivery chain.
Power Quality: Harmonics, Power Factor and Transient Demand
Power quality affects both equipment and transformer capacity:
- Harmonics: non-linear loads, such as some power electronics, draw current with harmonic content, which adds losses and heating in transformers beyond what the kVA figure shows. Transformers may need to be rated or derated for harmonic loads, using manufacturer data and applicable standards.
- Power factor: low power factor raises the kVA needed for a given kW.
- Transient demand: rapid load changes, motor starts and inrush currents can stress equipment and cause voltage dips.
- Voltage regulation: sensitive equipment needs stable voltage.
Electrical design addresses these through equipment selection, filtering, UPS design, protection coordination and system studies. The right approach depends on the specific loads.
Monitoring Transformer Loading and Planning Methods
| Measurement or Tool | What It Helps Identify | Limitations |
|---|---|---|
| Revenue and power metering | Demand in kW, kVA and energy at connection points | May not show conditions inside the transformer |
| Transformer temperature sensors | Oil, winding or surface temperature trends | Hot-spot values may be estimates; sensors can drift |
| SCADA and electrical power monitoring | Real-time current, power, alarms and status | Coverage and data quality vary by installation |
| Building management system (BMS) | Cooling and facility system operation | Not a substitute for electrical measurement |
| Energy management system (EMS) | Energy use, trends and efficiency | Depends on metering granularity |
| Historical load analysis | Peaks, growth rate and load factor | Past patterns may not predict new workloads |
| Forecasting and analytics | Expected future demand and capacity margins | Forecasts are uncertain and need validation |
| Condition monitoring and asset health | Signs of degradation under loading | Needs good data and engineering interpretation |
Monitoring improves visibility but does not replace engineering assessment. Related approaches are covered in transformer health monitoring, and the role of timely data in grid modernization and real-time visibility.
Forecasting, AI/ML Analytics and Asset Management
Forecasting estimates future demand from hardware plans, workload expectations, historical profiles, weather and expansion schedules. Machine learning can help find patterns in metered data, project loading and flag transformers trending toward limits, and analytics can combine loading with temperature and condition data. See transformer health analytics and AI transformer failure prediction.
These tools support planners, but their forecasts are uncertain, particularly for fast-changing AI workloads. Asset management ties the picture together by tracking transformer condition, maintenance and criticality, so that capacity decisions and maintenance priorities are consistent. See risk-based asset management. Analytics results should be reviewed by engineers before they drive decisions.
Common Planning Mistakes
| Mistake | Why It Matters | Practical Mitigation |
|---|---|---|
| Sizing from IT load alone | Omits cooling, losses and auxiliary demand | Estimate total facility demand by component |
| Confusing kW with kVA | Understates transformer loading | Convert using realistic power factor and check with measurement |
| Ignoring growth | Capacity runs out sooner than expected | Use phased scenarios and a documented growth allowance |
| Not assessing failure-case loading | Post-failure loading may exceed limits | Study loading with units out of service |
| Ignoring harmonics | Extra heating beyond kVA expectations | Measure or estimate harmonics and apply manufacturer guidance |
| Overlooking ambient conditions | Reduced cooling margin | Design for site temperature and ventilation |
| Assuming grid capacity will be available | Connection delays and constraints | Engage the utility early and plan phasing |
| Oversizing without analysis | Higher cost and low-load inefficiency | Balance headroom against cost and staged build-out |
| No monitoring plan | Overloads and trends go unnoticed | Install metering and temperature monitoring and review data |
Consequences of these mistakes include operational limits on computing deployment, overheating and accelerated ageing, reduced reliability and added financial cost from delayed or redesigned capacity. The severity depends on the case.
Practical Planning Approaches for New and Expanding Facilities
- Define requirements. Establish IT load scenarios, redundancy level and availability goals.
- Estimate total demand. Include cooling, losses and auxiliary loads by component.
- Convert to apparent power. Use realistic power factor values and check against equipment data.
- Plan for staged growth. Use phased capacity and modular blocks where suitable.
- Apply redundancy. Study normal and failure-case loading.
- Assess thermal limits. Use manufacturer data and applicable loading guides.
- Address power quality. Account for harmonics and transient loads.
- Coordinate with the utility. Confirm upstream capacity, timing and conditions.
- Specify monitoring. Plan metering, temperature sensing and data integration.
- Validate with qualified engineers. Review design against codes, standards and site conditions.
- Review after commissioning. Compare measured loading with design assumptions and adjust.
For expansions, measured data from the existing site is valuable. It shows actual power factor, peak demand and loading margins, which can replace assumptions.
Future Considerations
| Current | Emerging | Future |
|---|---|---|
| Redundant, phased power designs sized from forecasts | Higher rack densities and AI-driven load growth | More flexible loads that respond to grid conditions |
| Air and liquid cooling designs | Wider liquid cooling and modular data centers | Tighter integration of cooling, power and grid planning |
| Metering and SCADA-based monitoring | Analytics and machine learning for capacity forecasting | Digital twins for scenario planning |
| Utility connection studies | More coordination between operators and utilities | Grid modernization supporting large flexible loads |
Drivers include AI infrastructure growth, rising rack density, modular and prefabricated designs, liquid cooling, energy efficiency measures and grid modernization. Adoption varies, and emerging and future items are possibilities, not guaranteed outcomes. For the wider grid context, see the electric grid in 2035.
Key Takeaways
- Transformers are rated in kVA or MVA, while loads are described in kW or MW, and power factor links them.
- Total facility demand includes cooling, losses and auxiliary loads, not just IT equipment.
- Growth and redundancy raise installed capacity above the load served.
- Thermal limits depend on loading, ambient temperature, cooling and design, and must come from equipment-specific guidance.
- Utility interconnection capacity and lead times can limit what is achievable.
- Monitoring, forecasting and asset management support planning but require engineering validation.
Conclusion
Transformer capacity for data centers is an engineering and planning problem that links computing demand, cooling, redundancy, thermal limits and the capacity of the grid behind the site. The numbers in a spreadsheet only become a sound design after qualified engineers validate them against site conditions, manufacturer data, codes and the utility’s requirements. Facilities that plan for growth in stages, check failure-case loading, monitor what they build and revisit assumptions as AI workloads change are better placed to keep their power infrastructure matched to their computing load.
Frequently Asked Questions About Transformer Capacity for Data Centers
What is transformer capacity for data centers?
It is the apparent power, in kVA or MVA, that the transformers supplying a data center can deliver within their design limits. It must cover the facility’s total demand, including cooling and losses, plus planned growth and redundancy.
Actual usable capacity depends on conditions such as ambient temperature, cooling and harmonics.
Why is transformer capacity important for data centers?
Transformers limit how much power reaches computing equipment and cooling. Too little capacity restricts deployment and growth, and heavy loading can accelerate insulation ageing and affect reliability.
Too much unplanned capacity adds cost. Correct sizing supports reliable operation and staged expansion.
How do you calculate transformer capacity requirements for a data center?
Estimate total facility demand in kW by adding IT, cooling, losses and auxiliary loads, convert to kVA by dividing by power factor, then add growth allowance and apply redundancy. For example, 2,800 kW at 0.95 gives about 2,947 kVA (hypothetical).
Final sizing needs validation by qualified engineers using site data, codes and manufacturer information.
What is the difference between kW and kVA in data center power planning?
kW is real power, which does useful work and is how IT and cooling loads are usually described. kVA is apparent power, which determines current and transformer loading.
They are related by power factor: kVA equals kW divided by power factor. Sizing from kW alone can understate transformer loading.
How do AI workloads affect transformer capacity requirements?
AI hardware can raise power per rack and total demand, and some workloads change quickly, which can cause rapid load swings. Higher demand also increases cooling needs.
Planning should use scenarios, allow staged expansion and consider how fast load changes affect equipment and the grid connection. Specific effects depend on hardware and design.
How does redundancy affect data center transformer sizing?
Redundancy adds installed capacity beyond the load. N+1 adds an extra unit, and 2N provides two complete systems, so total installed capacity can be about double the load or more.
It also changes loading after a failure, so thermal limits must be checked for failure and maintenance cases, not only normal operation.
Can a data center operate a transformer close to its rated capacity?
It depends. Whether a transformer can run near its rating, and for how long, depends on its design, cooling, ambient temperature, harmonics, loading history, condition and the manufacturer’s and applicable loading guidance.
No universal answer applies. Engineers must assess the specific transformer and operating conditions before deciding.
How can operators monitor transformer loading and plan for future demand?
Operators use power metering, temperature sensors, SCADA or power monitoring systems, BMS and EMS data and historical load analysis. Forecasting and analytics project demand and flag margins.
These tools support planning but do not replace engineering review, and forecasts for fast-changing workloads remain uncertain.

I share real stories, practical ideas and honest perspectives on business, marketing and life. This blog is a space to learn, grow and connect.


