
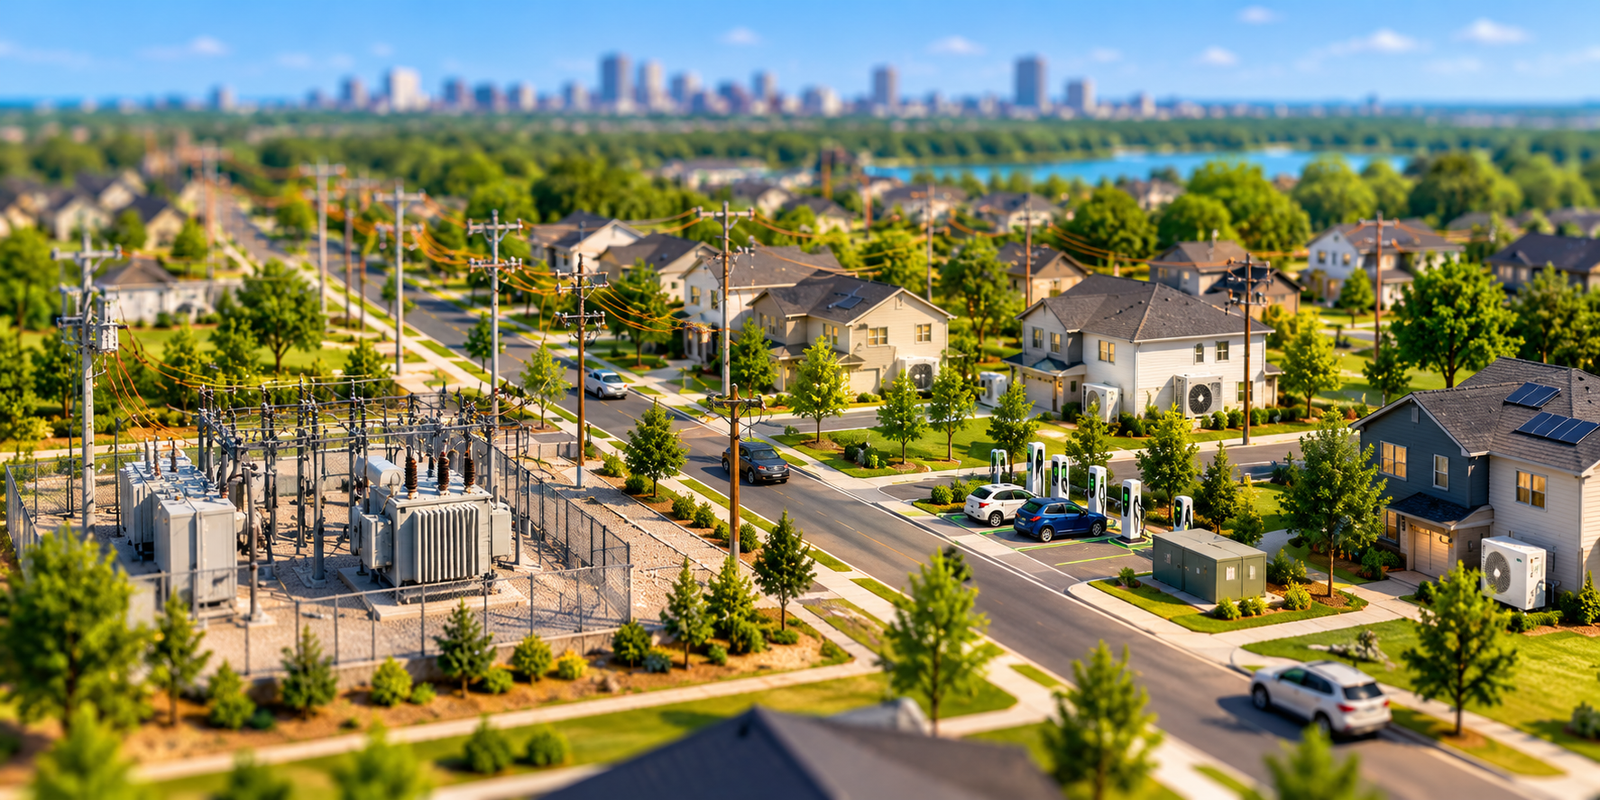
Electrification distribution planning is the engineering process of deciding how a local electricity network must change when transport, heating, cooling and industrial processes shift from fuels to electricity. Distribution networks were mostly designed around slowly growing, fairly predictable household and commercial demand. EV chargers, heat pumps, electric boilers and electrified industrial equipment add load that is larger, more concentrated and often more simultaneous than the loads these networks were sized for.
The central question for planners is simple to state: which transformers, feeders, substations and voltage-control devices will reach their limits, when, and what is the lowest-cost, lowest-risk response? This article explains how electrification changes electricity demand at the distribution level, how planners assess transformer and feeder capacity, and how a practical planning workflow fits together. It is written for grid planners, utility engineers and energy professionals, and it separates general engineering principles from illustrative numbers.
Key Takeaway
- Electrification mostly stresses the network locally, at service transformers, secondary circuits and individual feeders, before it stresses the system as a whole.
- Coincident peak demand, not connected load, determines most distribution capacity needs.
- EV charging and heat pumps can erode load diversity, which is the effect that normally keeps transformers and feeders from seeing the sum of every customer’s peak.
- Scenario-based forecasts, AMI interval data and managed charging are the main planning tools.
- Illustrative calculations here use stated assumptions and are not field measurements.
What Electrification Distribution Planning Means
Electrification distribution planning is the process of forecasting electrified load growth at local network level, testing it against equipment and voltage limits, and selecting upgrades, operational measures or flexibility options to keep the network safe and reliable.
It extends traditional distribution planning, which already covered load growth, reliability and asset renewal. What changes is the pace, the uncertainty and the load shape. Planners must work with technology adoption scenarios, not only historical growth rates, and must assess many more locations at finer detail. For background on how distribution networks fit into the wider power system, see transmission vs distribution networks and how power moves from generation to consumption.
How Electrification Changes Electricity Demand
Electrification changes both how much energy customers use and when they use it. Annual energy matters for system planning, but distribution assets respond to power, meaning the highest demand in a short interval.
Higher peaks, not only higher energy
A heat pump replaces fuel use with electricity, and its demand rises as outdoor temperature falls. An EV adds a large block of energy that can be delivered slowly over many hours or quickly in a short burst. In both cases the planning concern is whether the added power lands at the same time as existing peaks.
Residential, commercial and industrial load growth
- Residential: home EV charging, heat pumps, electric water heating and induction cooking. Evening arrival home charging tends to align with existing evening peaks.
- Commercial: depot and workplace charging, public fast-charging sites, electrified space and process heating, and building electrification retrofits. Single connections can be large relative to the local feeder.
- Industrial: electric boilers, furnaces, heat pumps for process heat and electrified material handling. These loads can be large, continuous and sensitive to power quality.
EV Charging and Its Effect on Peak Demand
Charging power depends on the equipment. A typical Level 2 home charger operates at 240 V and commonly in the range of several kilowatts, while public DC fast-charging sites can draw hundreds of kilowatts to megawatts per site. Charging behavior then determines how that power stacks up.
Unmanaged home charging often starts when drivers arrive home, which overlaps with the household evening peak. Time-of-use rates can help, but they can also create a new peak when many chargers start at the same moment an off-peak period begins. NREL has studied this effect and the value of coordinated approaches, and its work on EV grid impact analysis and smart-charge management uses feeder data and power-flow simulation to compare managed charging strategies.
For the broader technology picture, see future smart grid technology, which covers EVs, storage and distributed resources.
Coincident Peak Demand vs Connected Load
Connected load is the sum of the ratings of everything attached to a circuit. Coincident peak demand is the highest combined demand that actually occurs at the same time. Distribution assets are sized for something close to coincident demand, because customers rarely all peak together.
Two related terms are used in practice. The diversity factor is the sum of individual maximum demands divided by the maximum demand of the group, so it is always at least 1. The coincidence factor is its reciprocal.
Diversity factor = Σ(individual maximum demands) ÷ (group maximum demand)
Coincidence factor = 1 ÷ Diversity factor
Electrification can lower diversity. Many EV chargers on one transformer, or many heat pumps responding to the same cold morning, behave more alike than traditional appliances. A transformer that served a group of homes comfortably under historical diversity may be loaded much harder when several of them add similar large loads.
Transformer Loading, Sizing, Aging and Replacement Planning
Service transformers are among the first assets to feel residential electrification, because each serves a small group of customers and has little diversity to lean on.
How transformer loading is assessed
Transformers can be loaded above nameplate for limited periods, but doing so raises winding and oil temperatures and consumes insulation life faster. The IEEE C57.91 guide for loading mineral-oil-immersed transformers describes methods for estimating the effects of loading above nameplate, including insulation damage, gas production in oil and loss of life, and accounts for factors such as ambient temperature. A transformer’s aging therefore depends on its load duration and shape and on temperature, not only the peak value. Utilities set their own loading policies, so planners should apply the criteria that their organization and jurisdiction require.
Sizing and replacement planning
- Screen first, study second. Use meter data to flag transformers whose measured peak, plus expected EV or heat pump additions, approaches rated capacity.
- Prioritize by risk. Consider transformer age, loading history, number of customers served and likely adoption clustering.
- Replace proactively where it is cheaper. A planned replacement is generally less disruptive than an emergency one after an overload failure. Whether it is cheaper overall depends on local costs and on whether managed charging could defer it.
- Consider the secondary system. Service cables and secondary conductors can limit capacity even when the transformer does not.
NREL research on distribution service transformer loading with EV grid integration combines household smart meter load profiles with simulated EV charging, and reports that different smart charging strategies can produce substantially different transformer loading.
Illustrative example: a service transformer
Hypothetical example with assumed values. It is not a measurement from any real utility.
- Transformer: 50 kVA, serving 10 homes.
- Assumed diversified evening peak per home without EVs: 3.0 kVA, so about 30 kVA in total (60% of nameplate).
- Assumed Level 2 charger: 7.2 kW at a power factor of 0.95, which is about 7.6 kVA each.
| Case | Evening load (kVA) | Share of 50 kVA rating |
|---|---|---|
| No EV charging | 30.0 | 60% |
| 1 EV charging at peak | 37.6 | 75% |
| 3 EVs charging at peak | 52.7 | 105% |
The point is the sensitivity: three simultaneous chargers on one small transformer can push it past nameplate under these assumptions. Real results depend on actual household loads, charger behavior and transformer thermal characteristics.
Distribution Feeder Capacity and Thermal Limits
A feeder’s capacity is limited by several things, and the binding one differs by feeder. Conductor ampacity sets a thermal limit. Substation transformers, breakers, regulators and switchgear have their own ratings. Voltage limits often bind first on long rural feeders. Protection settings also constrain how much load or generation a feeder can accept.
Planners also test contingency capacity. A feeder may carry its load normally but not be able to absorb transferred load from a neighboring feeder during an outage, so electrification can quietly remove the margin that supports reliability.
Illustrative example: a feeder with a charging hub
Hypothetical example with assumed values, not field data.
For a three-phase feeder, current is I = S ÷ (√3 × V). At 12.47 kV, √3 × V is about 21.6 kV, so each 1 MVA corresponds to roughly 46 A.
- Assumed existing peak: 7.0 MVA, which is about 324 A.
- Assumed conductor rating of the limiting section: 400 A (about 8.6 MVA).
- New 1.5 MW fast-charging hub at a power factor of 0.98: about 1.53 MVA, or about 71 A.
The new peak is about 8.5 MVA or 395 A, which is roughly 99% of the assumed rating. The feeder might technically serve the hub in normal conditions but would have almost no headroom for growth or backup supply. A planner would then compare options such as a new feeder, reconductoring, load transfers, storage at the site or a flexible connection agreement.
Voltage Regulation, Voltage Drop and Power Quality
More current through the same conductors means more voltage drop. For a three-phase circuit, a common approximation for the voltage drop along a line is:
ΔV ≈ (R × P + X × Q) ÷ V   (line-to-line voltage V, total three-phase P and Q,
                             line resistance R and reactance X)
The consequence is that EV charging and heat pumps can pull customers at the far end of a feeder below acceptable voltage even when no equipment is overloaded. In the United States, ANSI C84.1 defines service-voltage ranges, with Range A at roughly plus or minus 5% of nominal, which corresponds to 114 to 126 V on a 120 V base. The USDA Rural Utilities Service explains these limits in Bulletin 1724D-114. Other countries use different standards and tolerances, so planners should apply the one that governs their network.
Other power quality questions include harmonics from power electronics, voltage unbalance on three-phase feeders, and flicker from large or rapidly varying loads. Responses range from tap and regulator adjustments to capacitor placement, volt/VAR control from smart inverters, conductor upgrades and, where needed, a new feeder.
Load Forecasting and Scenario-Based Planning
Historical trend extrapolation fails when the drivers of demand are changing structurally. Electrification distribution planning therefore uses scenarios: for example, slower and faster EV adoption, different heat pump uptake, and different charging behavior, each translated to the feeder or transformer level.
Good practice includes:
- Spatial allocation of adoption, since EVs and heat pumps cluster by neighborhood, housing type and income.
- Separate gross load and net load views where rooftop solar or batteries are present.
- Probabilistic outputs that show a range, so planners can judge risk and not just a central estimate.
- Regular re-forecasting as real adoption data arrives.
For more on methods and horizons, see AI for electricity load forecasting and the electric grid in 2035.
Smart Meters, AMI and Interval Consumption Data
Interval data from advanced metering infrastructure lets planners see load shapes by customer and, once aggregated, by transformer and feeder. This replaces coarse estimates based on billing energy with measured profiles. It can also reveal where EV charging or heat pumps are already appearing, even when the utility has no direct registration data.
Smart Meter → AMI → HES → MDMS → Data Quality → Transformer / Feeder Aggregation → Planning
Dependable results need a trustworthy meter-to-transformer connectivity model, since a customer assigned to the wrong transformer corrupts the loading estimate. Missing intervals and timestamp errors also need cleaning. Related reading: advanced metering infrastructure, smart meter data explained and the future of AMI.
Smart-Grid Monitoring, AI/ML Forecasting and Grid Analytics
Sensors, SCADA and AMI together improve visibility of the low-voltage and medium-voltage network. Analytics can then support three tasks: screening thousands of transformers for overload risk, estimating hosting capacity, and flagging locations where measured voltage or loading is drifting toward limits. Machine learning models can detect load patterns that suggest EV charging, but they should be validated against baselines and used with engineering review. See real-time grid data and AI in smart grids for related applications.
Distributed Energy Resources and Bidirectional Charging
Rooftop solar, batteries and, where enabled, bidirectional EV charging change the shape of load. Solar can reduce midday net load but does little for evening peaks, and high solar output can raise voltage on a feeder. Batteries and vehicle-to-home or vehicle-to-grid capability could, in principle, reduce peaks, but that depends on equipment, interconnection rules, customer participation and control arrangements. Planners should treat such flexibility as an assumption to be justified and tested, and not as guaranteed capacity.
Managed Charging, Demand Response and Flexible Loads
Flexibility is often the lowest-cost way to defer or reduce upgrades. Options include:
- Time-of-use rates that encourage off-peak charging, with randomization or staggering to avoid a rebound peak.
- Utility-managed or aggregator-managed charging that shifts or caps charging power.
- Grid-aware charging, where charging limits respond to measured transformer or feeder headroom.
- Demand response for heating and other thermal loads.
- Flexible connection agreements for large sites, which allow a connection with limits during constrained periods.
NREL’s EVI-DiST study, residential EV charging co-simulation for distribution power-flow impact analysis, tested several controls on four real feeders. It reported that randomized time-of-use control was most effective at reducing the number of transformers that were ever overloaded, while grid-aware controls were effective at reducing overload durations. Results are specific to the studied feeders and scenarios, so utilities should test options on their own networks.
Distribution-System Studies, Capacity Assessments and Investment
Planners combine several studies:
- Power-flow analysis for loading and voltage under peak and light-load cases.
- Hosting capacity analysis for how much load or generation a feeder can accept before limits are reached.
- Contingency analysis for backup supply and load transfer.
- Short-circuit and protection review where DERs or new sources are added.
- Economic comparison of wires solutions, such as replacing transformers or reconductoring, against non-wires solutions, such as flexibility, storage and rate design.
Investment decisions also depend on lead times. Transformers and switchgear can take a long time to procure, so waiting for overloads to appear can leave too little time to respond. The practical aim is a prioritized, staged program that is revised as adoption data arrives.
Comparison: Planning Considerations Before and After Electrification
| Consideration | Traditional Planning | Electrification-Aware Planning | Main Planning Tool |
|---|---|---|---|
| Load growth | Gradual, trend-based | Step changes driven by adoption and large connections | Scenario forecasting |
| Load shape | Stable daily and seasonal profile | New evening, overnight and cold-weather peaks | AMI interval data |
| Diversity | Relied on historical diversity | Lower diversity when loads align | Coincidence analysis |
| Transformers | Replaced mainly on age or failure | Screened for EV and heat pump loading | Loading and thermal models |
| Feeders | Checked at peak | Checked for peak, contingency and voltage | Power-flow studies |
| Voltage | Managed by regulators and taps | More drop under load, and rises with DERs | Volt/VAR control |
| Customer role | Passive load | Flexible load or resource | Managed charging, demand response |
| Investment | Wires solutions | Wires and non-wires options compared | Cost-benefit analysis |
Planning Challenges, Risks and Practical Solutions
- Uncertain adoption. Use several scenarios, track real adoption and update frequently.
- Poor network and customer data. Invest in a verified meter-to-transformer connectivity model and data cleaning.
- Over-building. Test flexibility before committing to large upgrades, but do not assume it will be delivered without enrollment and verification.
- Long equipment lead times. Pre-position spares and plan multi-year procurement for high-risk areas.
- Visibility gaps on low-voltage networks. Add monitoring where meter coverage is thin. See smart grid deployment challenges.
- Coordination across teams. Planning, operations, customer programs and regulators all influence outcomes, so shared assumptions help.
Applications for Utilities, DSOs and Consultants
- Electric utilities and distribution system operators: annual capacity screening, investment plans and connection studies.
- Grid planners: scenario forecasting, hosting capacity and non-wires evaluation.
- Engineering consultants: customer connection studies, feeder upgrade designs and fleet charging depot assessments.
- EV and fleet professionals: early engagement on available capacity and connection timelines.
A Step-by-Step Electrification Distribution Planning Workflow
- Define scope and horizon, such as a five-year capital plan with a longer outlook.
- Build or validate the network model, including meter-to-transformer connectivity and asset ratings.
- Gather load data from AMI, SCADA and substation measurements, and clean it.
- Set adoption scenarios for EVs, heat pumps, large connections and DERs.
- Allocate scenarios spatially to feeders, transformers and customer groups.
- Forecast coincident peak load for each location and scenario, with uncertainty ranges.
- Screen assets for thermal overload, voltage violations and loss of contingency capacity.
- Study flagged locations with power-flow, hosting capacity and contingency analysis.
- Compare solutions, including upgrades, load transfers, voltage control, storage and managed charging.
- Prioritize and schedule investment, considering procurement lead times and risk.
- Monitor and update as real adoption and load data arrive.
Future Trends in Distribution Planning
Several developments are likely to shape practice, although timing varies by utility. Planning is moving toward finer spatial resolution and more frequent updates. Utilities are adopting hosting capacity maps, probabilistic planning, grid-aware charging and more use of non-wires alternatives. Digital twins and AI-assisted screening may speed up study work, but they will need validated data and engineering review. Greater coordination between transport, building and grid planning also looks increasingly important.
Conclusion
Electrification distribution planning is about managing local capacity risk. The key shifts are from connected load to coincident demand, from trend extrapolation to scenarios, and from wires-only solutions to a mix of upgrades and flexibility. Utilities that combine AMI data, transparent assumptions and staged investment are better placed to connect new loads reliably. Standards and requirements differ by jurisdiction, so the calculations and limits here are starting points, and planners should apply the criteria that govern their network.
Frequently Asked Questions About Electrification Distribution Planning
What is electrification distribution planning?
Electrification distribution planning is the process of forecasting how electrified loads such as EV chargers, heat pumps and electric industrial equipment will change demand on local networks, testing that demand against transformer, feeder and voltage limits, and choosing upgrades or flexibility measures in response.
How does electrification distribution planning work?
Planners build adoption scenarios, convert them to coincident peak load at each transformer and feeder, and screen assets for thermal overload, voltage problems and loss of backup capacity. Flagged locations get detailed power-flow and contingency studies, and the utility then compares wires solutions with options such as managed charging before scheduling investment.
Why is electrification distribution planning important?
Electrified loads can arrive faster than traditional planning cycles assume, and they can reduce load diversity so local peaks rise sharply. Planning ahead helps avoid overloaded equipment, voltage violations and delayed customer connections, and helps utilities spend on the upgrades that are actually needed.
What are the main components of electrification distribution planning?
The main components are scenario-based load forecasting, AMI and SCADA data, a verified network model, transformer and feeder capacity assessment, voltage and power quality analysis, DER and flexibility assessment, and an economic comparison of wires and non-wires solutions.
What are the challenges of electrification distribution planning?
Challenges include uncertain adoption and charging behavior, incomplete network and customer data, limited visibility of low-voltage networks, long equipment lead times, the risk of over-building or under-building, and the need to coordinate planning, operations, customer programs and regulation.
Where is electrification distribution planning used?
It is used by electric utilities and distribution system operators for capital planning and connection studies, by grid planners for hosting capacity and non-wires evaluation, and by engineering consultants and fleet operators assessing the capacity available for new charging depots and electrified facilities.

I share real stories, practical ideas and honest perspectives on business, marketing and life. This blog is a space to learn, grow and connect.


