
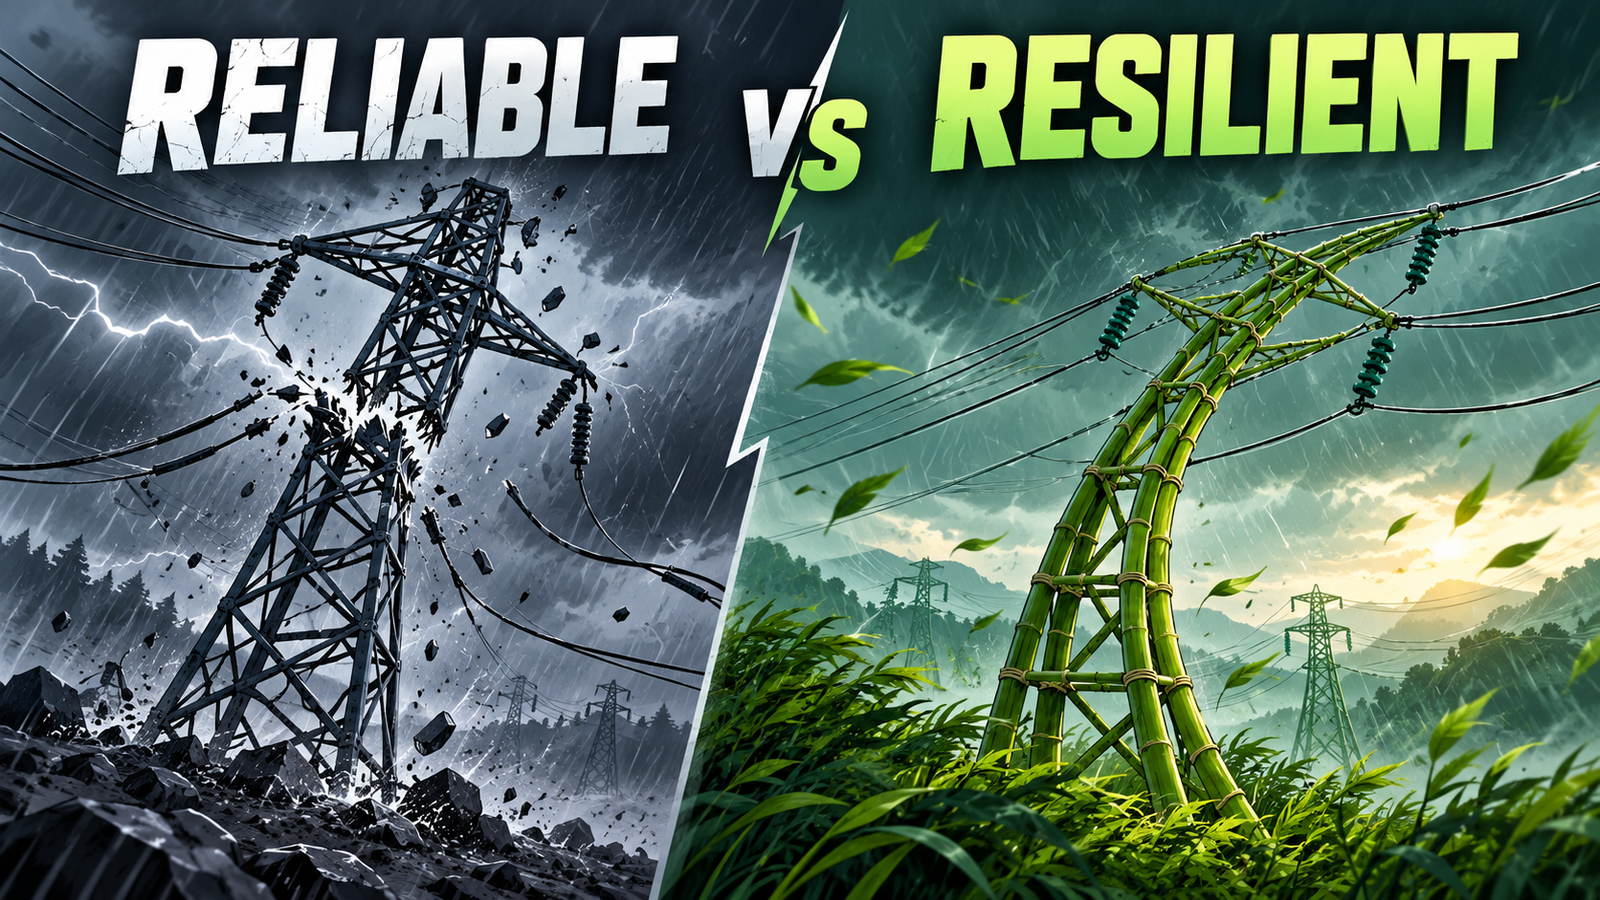
The core of grid reliability vs resilience is a difference in focus. Grid reliability is the ability of the power system to provide electricity consistently and to manage interruptions under expected or credible operating conditions. Grid resilience is the ability to prepare for, withstand, adapt to and recover from severe, disruptive or unexpected events.
Utilities use both ideas. Reliability describes how often and how long customers lose supply in ordinary operation, and it is tracked with metrics such as SAIDI and SAIFI. Resilience describes how well the system and the organization cope with high-impact events such as major storms, flooding or extended heat. The terms are often confused because both concern outages and restoration, and because the same equipment and processes contribute to both.
The distinction matters for planning and operations. A problem of frequent small interruptions calls for different actions than a rare event that damages large parts of the network. Exact definitions and reporting frameworks vary by jurisdiction and utility. For the foundation, see electric grid reliability.
Reliability: Outage Frequency → Outage Duration → Reliability Metrics → Maintenance → Operations → Planning
Resilience: Hazard Preparation → System Hardening → Adaptation → Response → Recovery → Restoration
Key Takeaway
- Grid reliability focuses on how consistently the power system performs and how often and how long customers experience interruptions.
- Grid resilience focuses on how well the system prepares for, withstands, adapts to and recovers from major disruptions.
- The concepts overlap and are complementary. Neither is universally more important.
What Is Grid Reliability?
Grid reliability is the ability of the power system to deliver electricity continuously and with acceptable frequency and duration of interruptions under expected operating conditions.
It rests on several elements: continuity of service, frequency and duration of interruptions, expected system performance, equipment condition, protection, maintenance, operations and restoration. Reliability is normally measured with established metrics so that performance can be compared over time, between areas and against targets.
What Is Grid Resilience?
Grid resilience is the ability of the power system and the utility to prepare for, absorb, adapt to, respond to and recover from severe or disruptive events.
- Preparation: understanding hazards and planning for them.
- Absorption: withstanding a disturbance without total loss of function.
- Adaptation: changing operations or configuration as conditions evolve.
- Response and recovery: organizing crews and resources.
- Restoration: returning service, prioritizing critical loads.
Relevant events can include severe storms, flooding, wildfires where applicable, extreme heat, major equipment failures, physical disruptions and other high-impact events. No single hazard applies to every utility, since exposure depends on geography and network design.
Grid Reliability vs Grid Resilience: Core Difference
| Dimension | Grid Reliability | Grid Resilience |
|---|---|---|
| Purpose | Keep supply consistent and limit interruptions | Limit impact of and recover from major disruptions |
| Primary question | How consistently does the grid deliver electricity? | How well can the grid withstand and recover from a major disruption? |
| Typical conditions | Normal and credible operating conditions | Severe, extreme or unexpected conditions |
| Time horizon | Everyday operation and annual performance | Event-based, from preparation through recovery |
| Main focus | Frequency and duration of interruptions | Preparedness, adaptability and recovery |
| Typical metrics | SAIDI, SAIFI, CAIDI, MAIFI, ASAI | Restoration time, critical-load restoration, recovery trajectory (frameworks vary) |
| Typical events | Equipment faults, routine weather, vegetation contact | Major storms, flooding, wildfires, extreme heat |
| Planning | Historical interruption analysis, capacity, asset condition | Hazard scenarios, critical loads, recovery strategies |
| Operations | Monitoring, switching, routine response | Emergency operations, mutual assistance, prioritization |
| Maintenance | Preventive, condition-based and predictive programs | Hardening, inspections before hazard seasons |
| Restoration | Speed of restoring routine outages | Coordinated recovery after widespread damage |
| Main technologies | SCADA, OMS, AMI, distribution automation | Redundancy, DERs, storage, microgrids, advanced situational awareness |
| Example | Reducing feeder interruptions from tree contact | Planning for rapid recovery after a major storm |
Reliability vs Resilience in Simple Terms
Reliability asks: “How consistently does the grid deliver electricity?”
Resilience asks: “How well can the grid withstand and recover from a major disruption?”
A grid can perform well on everyday measures and still struggle in an extreme event, and the reverse is also possible. Both questions matter.
Reliability Metrics
Common reliability indices describe interruption frequency and duration.
| Metric | Full Name | Formula | Interpretation |
|---|---|---|---|
| SAIDI | System Average Interruption Duration Index | Total customer interruption duration / Total customers served | Average outage time per customer |
| SAIFI | System Average Interruption Frequency Index | Total customer interruptions / Total customers served | Average number of interruptions per customer |
| CAIDI | Customer Average Interruption Duration Index | Total customer interruption duration / Total customer interruptions | Average duration of an interruption |
| MAIFI | Momentary Average Interruption Frequency Index | Total customer momentary interruptions / Total customers served | Average momentary interruptions per customer |
| ASAI | Average Service Availability Index | (Customer-hours served − Customer-hours interrupted) / Customer-hours served | Fraction of time supply is available |
Utilities use these metrics for comparison, targets, regulatory reporting and prioritizing investment. Limitations include averaging that can hide poor local performance, and dependence on accurate outage records. Exact reporting definitions and exclusions, such as how momentary interruptions or major event days are treated, can vary by jurisdiction or utility.
Resilience Metrics and Indicators
Resilience has no single universal metric equivalent to SAIDI or SAIFI, and measurement frameworks vary. Possible indicators include:
- Time to restoration after an event.
- Critical-load restoration and number of critical facilities restored.
- Recovery trajectory, meaning how service returns over time.
- Damage assessment speed.
- Availability of alternate supply paths and backup capability.
- Islanding capability where applicable.
- System hardening coverage.
- Emergency response capability.
No universal resilience formula is given here, because none is agreed across utilities and regulators. Indicators are chosen to fit local hazards and priorities.
Reliability and Resilience: Different Time Horizons
| Reliability May Focus On | Resilience May Focus More On |
|---|---|
| Normal operation | Severe events |
| Routine interruptions | Extreme conditions |
| Maintenance | Major disruption |
| Everyday operations | Emergency response |
| Expected system events | Recovery |
These are tendencies and not strict divisions. A long outage from an ordinary fault touches both ideas, and good preparation for rare events often improves everyday performance.
Grid Architecture and Both Concepts
Generation → Transmission → Substation → Distribution → Customer
| Layer | Reliability Considerations | Resilience Considerations |
|---|---|---|
| Generation | Availability, forced outages, reserves | Fuel supply and site exposure to hazards |
| Transmission lines | Fault rates, maintenance, contingency (N-1) planning | Exposure to wind, ice, fire; alternate paths |
| Substations and transformers | Condition, protection, spares | Flood protection, spare equipment strategy |
| Distribution feeders | Faults, vegetation, switching | Hardening, tie points, reconfiguration |
| Switchgear and protection | Correct operation and coordination | Robustness during widespread damage |
| Communication and control systems | Visibility and remote operation | Backup communications, situational awareness |
| Distributed energy resources | Effects on protection and voltage | Potential local supply during disruption |
Reliability Drivers
- Equipment condition and aging infrastructure influence failure likelihood.
- Protection performance determines how well faults are isolated.
- Maintenance quality affects fault frequency.
- Weather, vegetation and animals cause everyday faults.
- Human error in operations or work can cause interruptions.
- Network configuration decides how many customers a fault affects.
- Overloading stresses equipment.
- Communication systems and operational practices affect detection and response.
See what causes power grid failures for more detail.
Resilience Drivers
- Hazard exposure sets what the system must withstand.
- Infrastructure hardening and redundancy reduce damage and loss of function.
- Network flexibility enables rerouting.
- Distributed resources, storage, backup systems and microgrids where appropriate can support local supply.
- Emergency response, restoration planning and mutual assistance shape recovery speed.
- Communication resilience and situational awareness keep operators informed.
Power Outages: Reliability vs Resilience
The same outage can be viewed through both lenses.
| Reliability Perspective | Resilience Perspective |
|---|---|
| How frequently did interruptions occur? | Was the system prepared? |
| How long did they last? | How severe was the event? |
| How many customers were affected? | How quickly could the utility adapt? |
| What do SAIDI and SAIFI show? | How effectively was service restored, and were critical loads protected? |
| Could alternate supply paths be used? |
Outage Management
Outage Signal → Detection → Validation → Location → Isolation → Crew Dispatch → Restoration → Verification → Event Recording
An outage management system (OMS) coordinates this workflow using customer calls, AMI signals, SCADA data, field reports and the GIS network model.
- Reliability: better detection and restoration can improve interruption performance, and OMS records feed SAIDI and SAIFI.
- Resilience: effective emergency response and recovery coordination can reduce the impact of major disruptions.
AMI and Smart Meters
AMI can support both concepts.
- Reliability: outage detection, last-gasp signals, restoration verification, customer-level visibility and reliability analysis.
- Resilience: situational awareness, event visibility, restoration monitoring and, where appropriately integrated, information about critical customers.
AMI does not automatically replace SCADA or OMS. Communication loss does not automatically mean an electrical outage, because meters can go silent while power remains on. See advanced metering infrastructure and how smart meter data supports outage detection.
SCADA, DMS, ADMS and OMS
| System | Primary Function | Reliability Role | Resilience Role |
|---|---|---|---|
| SCADA | Monitoring and control of devices | Detects device operations, supports switching | Provides situational awareness during events |
| DMS | Distribution network management | Supports analysis and switching | Supports reconfiguration planning |
| ADMS | Integrated advanced distribution management | Optimizes operations, supports FLISR | Coordinates restoration across the network |
| OMS | Outage tracking and crew management | Reduces restoration time, records data for metrics | Coordinates large-scale response and recovery |
| GIS | Network and asset model | Links outages to customers and equipment | Supports damage assessment and planning |
| AMI | Customer-level metering and events | Outage detection and verification | Event visibility and restoration monitoring |
For how these systems fit together, see power system automation.
Reliability-Focused Maintenance
Maintenance approaches include preventive maintenance (scheduled), corrective maintenance (after failure), condition-based maintenance (triggered by measured condition), predictive maintenance (based on developing condition) and asset health monitoring.
Asset Condition → Failure Risk → Maintenance → Reliability Improvement
Good maintenance supports both reliability and resilience, since well-maintained assets are less likely to fail in ordinary conditions or under stress. See AI predictive maintenance for utility assets.
Resilience-Focused Planning
Options include system hardening, redundancy, alternate supply, network reconfiguration, undergrounding where appropriate, vegetation management, flood protection, backup generation, battery storage, microgrids, DERs and emergency operating procedures.
No solution is universally best. Resilience investments depend on local hazards, network characteristics, economics and regulatory requirements. A measure that suits a flood-prone area may add little elsewhere.
Reliability Planning vs Resilience Planning
| Reliability Planning | Resilience Planning |
|---|---|
| Historical interruption data | Hazard scenarios |
| SAIDI, SAIFI, CAIDI | Critical loads |
| Asset condition | Extreme events |
| Maintenance | Recovery strategies |
| Capacity | Hardening and redundancy |
| Network performance | Emergency response and backup resources |
Both can be combined in utility planning. Historical outage data can reveal weak points that also matter in extreme events, while hazard scenarios may justify investments that routine metrics alone would not.
System Hardening
Hardening makes equipment less likely to be damaged. Examples include stronger structures, equipment elevation, weather-resistant equipment, vegetation management, flood protection, fire-resistant approaches where applicable and undergrounding where appropriate. Hardening is one resilience strategy and not the entire definition of resilience, because a hardened system still needs response and recovery capability.
Redundancy and Network Flexibility
Alternate feeders, network reconfiguration, tie switches, backup supply, distributed generation, storage and microgrids give operators more ways to supply customers when part of the network is lost. Flexibility can help maintain service to unaffected areas or restore it sooner, provided capacity, protection and communications support the switching.
Distributed Energy Resources and Resilience
Solar PV, battery storage, microgrids, demand response, distributed generation and, where relevant, EVs can potentially support resilience by providing local supply or flexibility. They also add operational complexity, including effects on protection, voltage and safe restoration. DERs do not automatically improve reliability or resilience, and benefits depend on design, controls and interconnection practice.
Microgrids and Resilience
A microgrid is a local group of loads and energy resources that can operate connected to the main grid or, where designed to, separate from it in an islanded mode.
- Islanding lets part of the system keep operating when the main grid is lost.
- Critical-load support prioritizes essential facilities.
- Local generation and storage supply the island.
- Restoration support can help bring parts of the system back.
Microgrid operation differs from traditional grid operation because the local system must control its own voltage, frequency and protection when islanded. Safe operation relies on engineered controls and utility procedures, not ad hoc action.
Automated Restoration (FLISR)
Fault Detection → Fault Location → Isolation → Network Reconfiguration → Restoration
Fault location, isolation and service restoration uses reclosers, switches, sensors and a DMS or ADMS to isolate a faulted section and restore unaffected customers. It supports reliability by reducing the number of customers in long outages, and it can support resilience by speeding restoration when parts of the network are lost. It depends on communications, accurate network models, alternate supply capacity and coordinated protection. Crews still repair the fault.
Weather and Extreme Event Risk
Utilities may use weather forecasting, storm prediction, flood risk information, wildfire risk information where relevant, vegetation data, asset condition and historical outage data to prepare and respond. For example, forecasts can inform crew staging and inspections. Forecast uncertainty is real, so no numerical predictions are offered here. For analytics approaches, see AI for power outage prediction.
Grid Modernization
Technologies that can support both reliability and resilience include smart grid architecture, advanced sensors, AMI, digital substations, distribution automation, ADMS, AI/ML, predictive maintenance, advanced communications, DER management and energy storage. Benefits depend on integration, data quality and operating practice. See what a smart grid is, digital substations and grid modernization and real-time visibility.
AI and Analytics
Potential uses include outage prediction, asset failure-risk prediction, anomaly detection, weather-risk analysis, restoration analytics, reliability planning, asset health, load forecasting and resilience scenario analysis. See AI anomaly detection in electric utilities.
AI prediction and decision support are not protection and control. Models estimate risks and patterns for engineers. They are not an autonomous replacement for utility engineers or protection systems.
Practical Applications
| Application | Reliability Focus | Resilience Focus | Technology |
|---|---|---|---|
| Outage detection | Faster identification of routine outages | Event visibility in widespread outages | AMI, SCADA, OMS |
| Asset monitoring | Early detection of developing faults | Condition awareness before hazards | Sensors, analytics |
| Predictive maintenance | Fewer failures | Stronger assets under stress | ML, condition data |
| FLISR | Shorter outages for many customers | Faster partial restoration after damage | Reclosers, ADMS |
| Storm preparation | Limited, mainly routine weather | Staging, inspection, readiness | Weather analytics, planning |
| Distribution automation | Fewer customers affected | Network flexibility | Switches, communications |
| Microgrids | Local supply continuity | Islanded critical-load support | Local generation, controls |
| Battery storage | Peak and voltage support | Backup for critical loads | Batteries, inverters |
| DERs | Local support where well integrated | Possible local supply in disruption | Solar, storage, DER management |
| Reliability metrics | Track SAIDI, SAIFI, CAIDI | Provide baseline, not a direct measure | OMS, reporting |
| Emergency response | Routine crew response | Major event coordination | Procedures, OMS, communications |
| Restoration planning | Restoration priorities | Critical-load and staged recovery | ADMS, GIS, planning |
Hypothetical Example: Normal Distribution Outage
Hypothetical scenario. It describes no real utility or data.
Fault → Protection → Outage detection → OMS → Crew dispatch → Fault isolation → Restoration → Reliability metric
A branch contacts a conductor on a feeder. Protection operates and customers lose supply. AMI and SCADA signals reach the OMS, which identifies the affected section. A crew is dispatched, isolates the fault, and customers upstream are restored. The OMS records the customers affected and the duration, which later feed SAIDI, SAIFI and CAIDI. From a reliability perspective, the question is how often such events occur and how quickly they were cleared.
Hypothetical Example: Major Storm
Hypothetical scenario. It describes no real utility, event or statistics.
Severe Weather → Preparation → Monitoring → Damage → Emergency Response → Network Reconfiguration
→ Crew Restoration → Critical Load Recovery → Normal Operations
Forecasts warn of a severe storm, and the utility stages crews and confirms emergency plans. During the storm, monitoring shows widespread damage across several feeders. Emergency response begins, with operators reconfiguring the network to supply areas that remain intact and crews working under a prioritized plan. Hospitals and water facilities are restored first, then other customers, until normal operations resume. From a resilience perspective, the questions are how well the utility prepared, adapted and recovered, and whether critical loads were protected.
Hypothetical Example: Combined Reliability and Resilience
Hypothetical scenario. All details are illustrative.
A utility reviews a region with frequent tree-related faults and exposure to occasional severe storms.
- Asset maintenance: inspection and vegetation management reduce routine faults, which supports reliability.
- Automation: reclosers and tie switches allow fault isolation and rerouting.
- AMI, SCADA and OMS: together they provide detection, localization and verified restoration.
- DERs and storage: a battery at a critical facility can supply essential loads during an extended outage, with safe islanding controls.
- Emergency planning: storm procedures, crew staging and restoration priorities prepare for major events.
The same investments address both everyday interruptions and rare, severe disruptions.
Reliability vs Resilience Decision Framework
- Is the problem frequent routine interruption? Use a reliability-focused response: maintenance, protection, vegetation, automation.
- Is it a severe, low-frequency, high-impact event? Use a resilience-focused response: hazard planning, hardening, redundancy, emergency response.
- Does it involve both? Use a combined strategy.
This is a planning aid and not a rigid classification. Many problems sit between the two.
Common Misconceptions
| Misconception | Correction |
|---|---|
| Reliability and resilience are the same. | They are related but have different focus and time horizons. |
| High reliability means zero outage risk. | Outages still occur, and reliability describes average performance. |
| Resilience means preventing every outage. | It means withstanding, adapting to and recovering from disruption. |
| SAIDI and SAIFI measure resilience directly. | They measure interruption performance, not recovery capability per se. |
| Hardening alone creates resilience. | Response, recovery and flexibility are also needed. |
| DERs automatically improve resilience. | Benefits depend on design, controls and integration. |
| AI automatically improves reliability. | It helps only when data, validation and workflows support decisions. |
| AMI replaces OMS and SCADA. | It complements them. |
| Faster restoration always means better resilience. | Resilience also covers preparation, adaptation and critical-load priorities. |
Implementation Challenges
- Legacy infrastructure and data silos.
- Incomplete network models and poor asset records.
- Communication limitations and uneven monitoring coverage.
- System integration and vendor interoperability.
- Workforce capability and change management.
- Budget and regulatory requirements.
- Cybersecurity.
Reliability and Resilience Improvement Framework
- Measure reliability using standard metrics.
- Identify interruption drivers by cause and location.
- Assess resilience risks from relevant hazards.
- Identify critical assets and loads.
- Improve monitoring where visibility is weak.
- Improve protection coordination.
- Improve maintenance based on condition and risk.
- Improve outage management processes and data.
- Add automation where it fits the network.
- Evaluate hardening and redundancy against local needs.
- Improve emergency response and restoration planning.
- Monitor results against targets.
- Reassess priorities as conditions change.
Current, Emerging and Future Technology
| Current | Emerging | Future / Experimental |
|---|---|---|
| Reliability metrics | AI reliability analytics | Advanced digital twins |
| SCADA | ADMS | More autonomous restoration |
| OMS | FLISR | AI-assisted resilience planning |
| AMI | Advanced sensors | Highly adaptive distribution networks |
| Distribution automation | Predictive maintenance | |
| Asset management | Advanced weather analytics |
Adoption varies by utility. Future items are possibilities and not current practice.
Benefits
Distinguishing and managing both concepts supports better planning, better maintenance prioritization, better outage response, better emergency preparedness, improved asset visibility, more informed investments, better restoration planning and better customer communication. No percentage improvements are promised.
Limitations
- No single metric captures all reliability and resilience dimensions.
- Data limitations and varying local conditions.
- Extreme events are difficult to model.
- Reliability metrics may hide localized issues.
- Resilience measurement frameworks vary.
- Technology alone cannot solve reliability problems.
- Human and organizational factors matter.
Future of Grid Reliability and Resilience
Likely directions include AI-assisted reliability analysis, advanced AMI, grid-edge sensors, digital substations, ADMS, automated restoration, predictive maintenance, DERs, battery storage, microgrids, digital twins, advanced weather analytics and resilience scenario planning. Some are in use today, others are emerging, and a few remain experimental. See the electric grid in 2035 for outlooks.
Summary
Grid reliability is consistent delivery and management of interruptions under expected conditions, measured with SAIDI, SAIFI, CAIDI and related indices. Grid resilience is the ability to prepare for, withstand, adapt to and recover from major disruptions, measured with varied indicators. Outage management, maintenance, planning and grid modernization contribute to both, and practical applications often serve both goals.
Conclusion
Grid reliability and grid resilience are complementary concepts. Reliability focuses on consistent system performance and interruption management. Resilience focuses on preparing for, responding to and recovering from major disruptions.
Modern utilities need both perspectives to build reliable day-to-day operations and stronger responses to severe events.
Frequently Asked Questions About Grid Reliability and Resilience
What is the difference between grid reliability and grid resilience?
Grid reliability concerns how consistently the grid delivers electricity and how often and how long interruptions occur under expected conditions. Grid resilience concerns how well the system prepares for, withstands, adapts to and recovers from severe or disruptive events.
They are related and overlap, but they ask different questions and use different measures.
How do grid reliability and resilience work together?
Many measures support both. Maintenance, automation, monitoring and outage management reduce everyday interruptions and also help the system cope with major events. Resilience measures such as redundancy and emergency planning can also reduce routine outage impacts.
Utilities combine reliability metrics with hazard-based planning to decide where investment helps most.
Why are grid reliability and resilience important?
Homes, hospitals, industry and communications depend on continuous electricity. Reliability limits everyday interruptions, while resilience limits the impact of rare, severe events and speeds recovery.
Together they guide investment and operating practice, protect critical services and support customer confidence, with priorities set by local hazards and regulatory requirements.
What are the main components of grid reliability and resilience?
Reliability components include equipment condition, protection, maintenance, monitoring, outage management and planning. Resilience components include hazard assessment, hardening, redundancy, network flexibility, backup resources, emergency response and recovery.
Technologies such as SCADA, OMS, AMI, automation, DERs and storage support both, and data and workforce capability underpin them.
What are the challenges of improving grid reliability and resilience?
Common challenges include legacy infrastructure, data silos, incomplete network models, limited monitoring and communication coverage, system integration and vendor interoperability. Budget limits, regulatory requirements, workforce skills and cybersecurity also matter.
Extreme events are hard to model, and no single metric captures every dimension, so utilities rely on combined measures and judgment.
Where are grid reliability and resilience managed?
They are managed across planning, engineering, operations and emergency management. SCADA, DMS, ADMS, OMS, GIS and AMI support day-to-day operations and data, while reliability and planning teams analyze outage records and set investment priorities.
Resilience planning also involves emergency response, mutual assistance and coordination with other organizations.
How are SAIDI and SAIFI related to grid reliability?
SAIDI measures average outage duration per customer, and SAIFI measures average number of interruptions per customer. Both are standard reliability indices, and CAIDI links them as SAIDI divided by SAIFI.
They describe interruption performance, not resilience directly. Definitions and exclusions, such as major event treatment, vary by jurisdiction and utility.
How do utilities improve both grid reliability and resilience?
Utilities measure performance, find interruption drivers and hazard risks, and improve maintenance, protection, monitoring and outage management. They add automation, evaluate hardening, redundancy, DERs and storage, and improve emergency response.
Results are monitored and priorities reassessed. Effective programs combine technology with engineering practice and operating procedures.

I share real stories, practical ideas and honest perspectives on business, marketing and life. This blog is a space to learn, grow and connect.


