
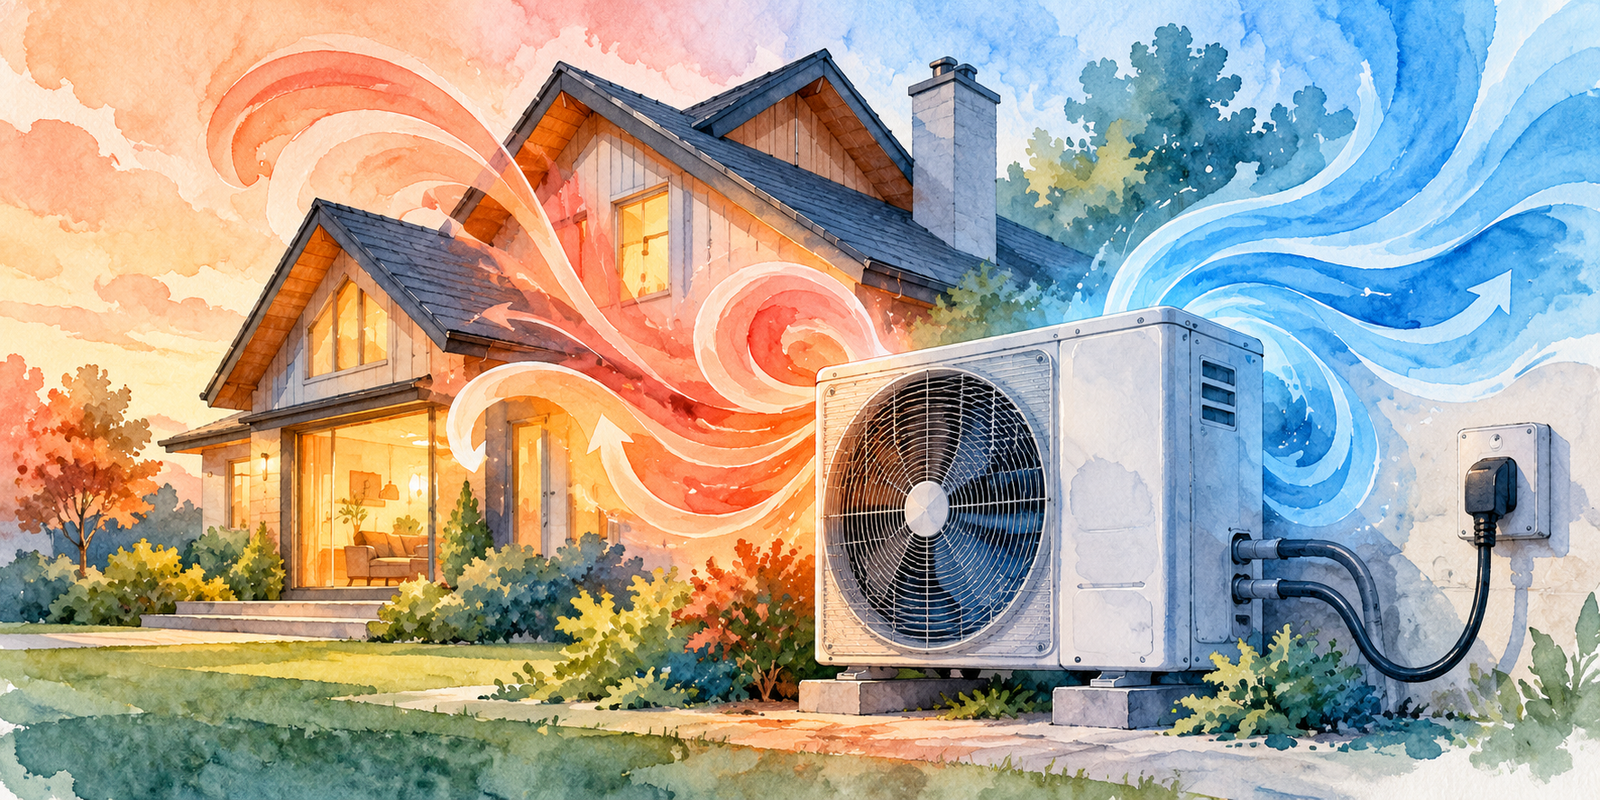
Heat pumps are one of the main technologies used to electrify building heating. By replacing boilers and furnaces that burn fuel on site, they move a share of heating energy onto the electricity system. That can change when and where electricity is needed, especially in cold weather. Understanding heat pump electricity demand is therefore a practical concern for grid planners, utility engineers and energy strategists, and not only for building owners.
The central answer is this: heat pumps add electrical demand for heating, and their grid impact depends on building heat requirements, equipment efficiency, weather, supplementary heating, operating schedules and the existing distribution network. Heat pump adoption does not automatically overload the grid. Outcomes depend on local conditions, so planning must be local too. This guide explains how heat pump loads are formed, how they reach transformers, feeders and substations, and how utilities forecast and manage them. For background on the networks involved, see transmission vs distribution networks.
Key Takeaway
- Heat pumps use electricity to move heat, so they deliver more heat than the electricity they consume, but they still add electrical load.
- Annual energy and winter peak demand answer different planning questions and must be forecast separately.
- Cold weather can raise demand across many buildings at the same time, so coincidence matters.
- Building efficiency, equipment performance and controls can reduce peaks, but not always remove the need for network upgrades.
- Impacts are local; no universal loading limit or upgrade rule applies.
What Is Heat Pump Electricity Demand?
Heat pump electricity demand is the electrical power a heat pump draws, and the electrical energy it uses over time, to deliver heating (and in some systems cooling or hot water) to a building.
Several related quantities are easy to confuse. Utilities treat them as separate inputs:
| Term | Meaning | Typical Unit | Relevance to Utility Planning |
|---|---|---|---|
| Electrical power drawn | Rate at which the heat pump uses electricity at a moment | kW | Sizes service connections, transformers and feeders |
| Electricity consumed | Electrical energy used over a period | kWh, MWh | Drives annual energy forecasts and billing |
| Useful thermal energy delivered | Heat supplied to the building | kWh (thermal) | Shows what the building needs, separate from electricity used |
| Building heating demand | Heat the building requires to stay at target temperature | kW or kWh (thermal) | Sets the basis for equipment size and load |
| Peak electrical demand | Highest electrical power in a period, such as a cold day | kW, MW | Often the binding constraint for network capacity |
| Total building electricity demand | All electrical loads in the building, not only heating | kW, kWh | Heat pump load adds to existing household or commercial load |
| Available grid capacity | What the local network can deliver at that location | kVA, MVA | Compared against aggregated demand to find constraints |
Power (kW) and energy (kWh) are different. A heat pump can use modest energy over a year yet draw a high power on the coldest hour. Network equipment is limited by power and heating, not by annual energy. This is why peak and energy forecasts must be kept apart.
How Do Heat Pumps Work?
A heat pump does not create heat by burning fuel or by resistance. It uses a refrigerant cycle to move heat from one place to another. A compressor raises the refrigerant’s pressure and temperature. A heat exchanger releases that heat to the building. An expansion device lowers the pressure again, and a second heat exchanger absorbs heat from the outside air, the ground or another source. Electricity is needed mainly to run the compressor, along with fans, circulation pumps and controls.
Types and Applications
- Air-source heat pumps take heat from outdoor air. They are widely used in homes and commercial buildings. Some deliver warm air; others heat water for radiators or underfloor systems.
- Ground-source (geothermal) heat pumps exchange heat with the ground through buried loops and a circulation pump. Ground temperatures are more stable than air temperatures, which can make performance less sensitive to weather.
- Heat pump water heaters heat domestic hot water and add a smaller, steadier load.
- Commercial and larger systems serve offices, shops, apartment buildings and district or process heating.
Many units are reversible and can cool in summer by running the cycle in the opposite direction. Cooling use adds to summer electricity demand where installed.
Heat Delivered vs Electricity Consumed
The coefficient of performance (COP) is the ratio of useful heat delivered to electrical energy consumed, over a defined period or operating condition. It is not a fixed property of a unit. It changes with outdoor temperature, delivery temperature, equipment design, operating conditions and system configuration.
The following example is illustrative only. No single COP applies to every unit, climate or operating condition.
COP = useful heat delivered ÷ electrical energy consumed
Heat required: 9 kW (thermal)
At COP 3.0: electrical input = 9 ÷ 3.0 = 3.0 kW
At COP 2.0: electrical input = 9 ÷ 2.0 = 4.5 kW
The same heat output needs 50% more electricity at COP 2.0 than at COP 3.0. This is why performance in cold weather matters for network planning. It also explains how a heat pump can deliver more heat than the electricity it draws, without breaking any conservation law. The extra heat is moved from the surroundings.
The Main Factors That Determine Heat Pump Electricity Demand
Electricity use depends on the building’s heat needs and on how efficiently the equipment meets them. Many factors interact, which is why averages can mislead.
| Factor | Possible Effect on Energy and Peak Demand | Forecasting Implication |
|---|---|---|
| Outdoor temperature and weather | Colder weather raises heat needs and can lower COP | Use weather-driven models, including extreme-cold scenarios |
| Building size, insulation, air leakage | Poorer buildings need more heat, raising both energy and peak | Segment building stock by efficiency |
| Required indoor temperature | Higher setpoints raise heat needs | Include setpoint and behavior assumptions |
| Heat pump type, sizing and performance | Affects power drawn at each condition | Use realistic performance curves, not a single COP |
| COP and operating conditions | Lower COP raises electricity for the same heat | Model COP as a function of temperature |
| Supply-water or air-delivery temperature | Higher delivery temperatures usually reduce COP | Distinguish low- and high-temperature systems |
| Schedules and thermostat settings | Shape the daily profile and morning or evening peaks | Model behavior and set-back patterns |
| Defrost operation | Temporary extra electricity use in some conditions | Include in cold, humid-weather behavior where relevant |
| Supplementary or resistance heating | Can add substantial power at the coldest times, where installed | Treat as a separate assumption by installation type |
| Domestic hot water demand | Adds smaller, often evening or morning load | Include water heating in building loads |
| Cooling operation and seasonal use | Adds summer demand for reversible systems | Forecast summer and winter separately |
| Occupancy and usage patterns | Change when and how much heat is used | Use usage segments, not one household profile |
Seasonal Load Profiles and Winter Peak Demand
Heat pump demand often has strong seasonal and weather-related patterns, because heating needs rise as temperature falls. The profile still varies by climate, building type, system design and cooling use, so it should not be assumed to be the same everywhere.
- Cold-weather heating: demand rises as outdoor temperature falls, and COP may fall at the same time, so electricity needs can rise faster than heat needs.
- Daily profile: many buildings heat more in the morning and evening, which can create daily peaks, though set-back schedules and controls change this.
- Coincidence: in a cold spell many buildings heat at once. Diversity, meaning that not all loads peak at the same moment, lowers aggregate peaks, but extreme cold reduces diversity.
- Annual energy vs peak power: a system can use modest energy over a year while contributing a high peak on the coldest hours.
- Supplementary heating: where installed and used, it can raise peak demand during the coldest conditions.
- Cooling: reversible systems add summer load, which may matter more in warm regions.
| Condition | Likely Operating Pattern | Grid-Planning Concern | Forecasting Inputs |
|---|---|---|---|
| Mild heating season | Moderate, steady operation | Energy growth more than peak | Average temperature, building mix |
| Cold weather | Higher output, lower COP, longer run times | Rising peak on local equipment | Temperature scenarios, COP curves |
| Extreme cold spell | Many units at high output together; possible supplementary heat | Highest coincidence and stress on transformers and feeders | Extreme-weather scenarios, supplementary heat assumptions |
| Morning or evening routines | Heating and hot water overlap with other household loads | Daily peak shaping | Interval data, schedules and behavior |
| Summer (reversible systems) | Cooling operation | Summer peaks on some networks | Cooling share, summer temperatures |
Regional variation is large. A cold-climate region with poorly insulated homes can look very different from a mild region with well-insulated buildings, and neither can stand in for the other. For the wider context of rising demand, see the electric grid in 2035.
One published reference point is worth noting. The International Energy Agency (IEA), in its 2022 report The Future of Heat Pumps, found that households adding a heat pump without improving building efficiency could see their winter peak demand rise sharply, and that efficiency improvements can substantially reduce the growth in peak demand. Those findings come from IEA scenario analysis and may not match any particular network.
How Heat Pumps Affect Distribution Transformers, Feeders and Substations
Heat pump load reaches the network at several levels. At each level, aggregation and local conditions determine whether capacity is a concern. For more on how these assets are described, see how electricity moves through generation, transmission and distribution networks.
Distribution Transformers
A distribution transformer serves a small group of customers, so its loading reflects the combined demand of those customers. Heat pump loads add to existing load, and the result depends on how many customers have heat pumps, how large the buildings are, the weather and how much of the load coincides. Transformer utilization is judged against its rating, load profile, ambient conditions and condition. Small groups have less diversity, so their peaks can be proportionally higher than the average for the whole area.
Distribution Feeders
Feeders carry power from substations to many transformers. Localized concentrations of heating electrification, such as a neighborhood where many homes switch together, can raise feeder loading and affect voltage along the circuit. Service-area characteristics such as housing type, building age and circuit length matter, and voltage conditions at the end of long feeders can be more sensitive.
Distribution Substations
Substations aggregate many feeders. Geographically concentrated electrification can raise substation demand, especially in the winter. This feeds into longer-term reinforcement planning, because substation upgrades take time and need advance notice. Existing spare capacity, other planned loads and the seasonal timing of the peak all influence the picture.
Customer Service Connections and Building Equipment
Inside the property, the electrical service, main panel and wiring have their own capacity. Adding a heat pump, along with other new loads such as EV charging, may need a site-specific assessment. Some installations will fit within existing service capacity and others may not, depending on the equipment, the building’s loads and the service rating. Actual upgrade requirements depend on local engineering conditions. This article gives no universal loading limits, and not every heat pump installation requires a grid upgrade.
What Are the Main Challenges of Heat Pump Electricity Demand?
| Challenge | Practical Significance | Possible Planning or Operational Response |
|---|---|---|
| Uncertain adoption and retrofit rates | Forecasts depend on how fast and where heat pumps are installed | Use scenarios; update with installation data |
| Cold-weather peaks and coincident loads | Peaks may occur on the coldest hours, when many units run together | Plan with extreme-weather scenarios and diversity assumptions |
| Variation in equipment performance | Different units draw different power at the same temperature | Use measured or manufacturer performance data by type |
| Older or poorly insulated buildings | Higher heat needs mean larger electrical loads | Prioritize efficiency measures alongside installation |
| Supplementary resistance heating | Can raise peak load when used | Include as a separate assumption; consider system design options |
| Limited visibility into building loads | Planners may not know which customers have heat pumps | Use AMI data, installation records and analytics |
| Local network constraints | Some areas have less spare capacity | Assess locally; stage upgrades and use flexibility where feasible |
| Installation and service requirements | Site wiring and service capacity may limit installation | Early site assessment and coordination with installers |
| Investment and project timelines | Upgrades take time and capital | Early planning and coordinated delivery |
| Balancing reliability, affordability and decarbonization | Objectives can pull in different directions | Transparent planning and stakeholder coordination |
None of these responses removes uncertainty. They reduce risk, and the right mix depends on local conditions, regulation and costs.
How Utilities Forecast Heat Pump Electricity Demand
Forecasting combines data about the network, the weather and the building stock. Annual energy forecasts and winter peak-demand forecasts answer different questions. Energy forecasts inform generation, supply and revenue planning. Peak forecasts inform network capacity, because equipment limits depend on the highest loads. A forecast that is good for one can be poor for the other. See AI for electricity load forecasting for the methods involved.
| Input | Purpose | Limitation |
|---|---|---|
| Historical consumption and load data | Establish the baseline and seasonal patterns | May not reflect new loads or future behavior |
| Weather records and forecasts | Link demand to temperature | Extremes are rare, so data is limited |
| Building stock and heating-system data | Estimate heat needs and what is replaced | Records may be incomplete or out of date |
| Adoption scenarios | Estimate how many and where heat pumps are installed | Depends on policy, costs and customer decisions |
| Equipment performance assumptions | Convert heat needs to electrical demand | Real-world performance varies by installation |
| Efficiency and retrofit trends | Adjust heat needs over time | Pace of retrofits is uncertain |
| Geographic distribution | Map load to transformers, feeders and substations | Clusters can form unpredictably |
| Schedules and customer behavior | Shape daily profiles | Behavior can change with tariffs and controls |
| Supplementary heating assumptions | Capture extra peak load where it exists | Usage is hard to observe |
| Scenario analysis | Express uncertainty across plausible futures | Scenarios are not predictions |
Forecasts are uncertain by nature, so planners often compare several scenarios and update them as installation and metering data arrive. Forecast error should be treated as a planning input, not an afterthought.
Managing Heat Pump Loads Through Controls and Flexibility
Several approaches can reduce or reshape heat pump demand. Each has trade-offs among comfort, energy use and equipment performance.
- Smart thermostats and scheduled operation: can avoid unnecessary use and shift when heating happens.
- Demand response: where available, can reduce load at stressed times, subject to customer participation and comfort limits.
- Thermal storage and preheating: a building or storage tank can be heated ahead of a peak so that less power is drawn during it. This may raise total energy use slightly.
- Insulation and weatherization: lower heat needs, which reduces both energy and peak.
- Heat pump sizing and system design: well-matched sizing and delivery temperatures support better performance.
- Limiting supplementary resistance heating: where design and operating conditions allow, using less of it reduces peak load.
- Time-based tariffs: where applicable, can encourage shifting but depend on customer response.
- Coordination with other building loads: such as EV charging, so loads do not all coincide.
Controls cannot always eliminate a cold-weather peak, and they cannot replace required infrastructure upgrades where capacity is genuinely short. Shifting load earlier can create a new peak, and aggressive set-backs can create a rebound when many units restart together. Flexibility reduces risk and defers investment in some cases, but it works alongside physical capacity and not instead of it.
How AMI, Smart Grids and AI/ML Help With Heat Pump Planning
Data helps planners see where heat pumps are, how they behave and how local equipment is loaded. For related context, see why smart grids need real-time electricity data.
| Technology | Use Case | Potential Value | Limitations |
|---|---|---|---|
| Advanced metering infrastructure (AMI) | Collect interval consumption data | Reveals load shapes and cold-weather behavior | Shows whole-premise load, not the heat pump alone |
| Smart meters and consumption data | Detect changes in load patterns | Helps estimate adoption and demand | Privacy rules and data quality apply |
| Feeder and transformer monitoring | Measure loading on network assets | Shows real utilization against ratings | Coverage is partial on many networks |
| Weather-linked load analysis | Relate demand to temperature | Supports cold-weather peak estimates | Limited extreme-weather data |
| GIS-based mapping | Map electrification by location | Links load growth to specific assets | Needs accurate and current records |
| AI/ML demand forecasting | Forecast load across horizons | Can capture nonlinear weather effects | Needs validation and good training data |
| Scenario modeling and anomaly detection | Test futures and spot unusual behavior | Supports planning and operations | Output needs engineering review |
| Distribution planning and operational systems | Integrate network models and forecasts | Connects load to constraints | Integration effort and data dependencies |
AMI and AI/ML can improve visibility and forecasting, as described in advanced metering infrastructure and AI in smart grids. They do not create physical grid capacity on their own. Data quality, privacy, model validation and local conditions all matter. A model trained on a mild winter may fail in a severe one, so extreme conditions need explicit attention.
Heat Pumps, Building Efficiency and the Energy Transition
Heat pumps interact with other parts of the energy system:
- Building insulation and air sealing: reduce heat needs, so a smaller and cheaper heat pump may be enough and peak demand is lower.
- Heating-system replacement: timing and equipment choices determine what gets replaced and when.
- Electricity generation mix: determines the emissions associated with the electricity used.
- Direct fossil-fuel use: falls where heat pumps replace fuel-burning equipment.
- Seasonal demand and renewable electricity: winter heating demand may or may not align with renewable output in a given region.
- Thermal storage and flexibility: can help align heating with supply.
- Household and commercial costs: depend on equipment, tariffs and building condition.
Electrification may increase electricity consumption while reducing direct fuel use. The effect on total energy use, operating costs and emissions depends on the heat pump’s real-world performance, the heating system replaced, building conditions, electricity tariffs and the generation mix. It would be wrong to say that total energy or emissions always rise or always fall.
The IEA reported that global heat pump sales grew by about 11% in 2022, and that heat pumps then met roughly 10% of heating needs in buildings (IEA commentary, 2023). In its 2022 analysis, the IEA also found that, in a scenario consistent with existing climate pledges, heat pumps would contribute less than a tenth of the rise in global electricity demand to 2030. These are global, scenario-based figures and may not represent any given region. For wider context, see future smart grid technology.
Illustrative Distribution-Planning Scenario
This is a hypothetical example. It does not describe a real utility or project, and it makes no claim about savings. Every number is an illustrative assumption used to show method.
Setting. A utility serves a residential area where heat pump adoption is rising. One distribution transformer serves 50 homes. The planners follow these steps.
1. Establish existing winter demand. Assume the existing winter peak, after diversity, is 1.8 kW per home. For 50 homes: 50 × 1.8 = 90 kW.
2. Estimate adoption and heating needs. Assume 30% adoption, so 15 homes have heat pumps. Assume each home needs 8 kW of heat at the design cold temperature.
3. Model weather-sensitive demand. Assume COP falls to 2.5 at the design cold temperature.
Electrical input per heat pump = 8 ÷ 2.5 = 3.2 kW
Coincidence assumption in extreme cold = 0.8
Heat pump peak on this transformer = 15 × 3.2 × 0.8 = 38.4 kW
4. Separate annual energy from peak demand. Assume each home needs 12,000 kWh of heat per year at a seasonal COP of 3.0.
Annual electricity per heat pump = 12,000 ÷ 3.0 = 4,000 kWh
Average power = 4,000 ÷ 8,760 h ≈ 0.46 kW
Design-cold peak per unit = 3.2 kW → about 7 times the annual average
The annual energy figure would understate the peak by a wide margin, so a forecast built only on energy would miss the constraint.
5. Map loads to equipment. Assume a power factor of 0.98.
Transformer peak = 90 + 38.4 = 128.4 kW → 128.4 ÷ 0.98 ≈ 131 kVA
Against a 100 kVA rating: ≈ 131%  |  Against a 150 kVA rating: ≈ 87%
Actual assessments use thermal limits, load profiles, ambient conditions and asset condition, not a simple percentage. The same logic then applies upward to feeders and the substation, using their own aggregated loads and diversity.
6. Test performance and supplementary heating assumptions. If 3 of the 15 homes also use 3 kW of supplementary resistance heating at the coldest hours (coincidence 0.8), that adds 3 × 3 × 0.8 = 7.2 kW, raising the peak to about 135.6 kW. The sensitivity to this assumption shows why it should be tracked separately.
7. Evaluate flexibility and upgrades. Planners compare options: a larger transformer, load control for some units, building efficiency programs or a combination. Flexibility may reduce the peak but may not remove it, so they check whether the remaining loading is acceptable.
8. Monitor and update. After installation, AMI and transformer monitoring show actual winter loads. Planners compare them with assumptions and update the forecast.
For comparison of fuel and electricity, assume a replaced gas boiler is 90% efficient: delivering 12,000 kWh of heat uses 12,000 ÷ 0.9 ≈ 13,300 kWh of fuel. The heat pump uses 4,000 kWh of electricity for the same heat. Electricity use rises while fuel use falls, and whether total energy or emissions change depends on the actual figures involved.
Practical Checklist for Grid Planners and Energy Professionals
| Area | Questions to Answer |
|---|---|
| Adoption forecasts | How many heat pumps, where and by when, under several scenarios? |
| Building stock and heating needs | What are the building types, efficiency levels and heat requirements? |
| Weather scenarios | Which typical and extreme temperatures are modeled? |
| Equipment performance and COP | Are COP assumptions tied to temperature and delivery conditions? |
| Annual consumption | What is the expected annual electricity use? |
| Winter peak and coincidence | What peak and diversity are assumed at each network level? |
| Supplementary heating | Is it present, and how much is assumed to run at peak? |
| Transformer and feeder capacity | How does the new loading compare with the actual capability of assets? |
| Flexibility and efficiency | Which controls and building measures are realistic? |
| Forecast uncertainty | Are ranges and sensitivities documented? |
| Monitoring and updates | How will actual loads be tracked and forecasts revised? |
Future Outlook: Heat Pumps and the Future Grid
Several trends may shape how heat pumps affect electricity demand. Wider adoption of building electrification would raise winter electricity use in many regions. Better building efficiency can limit the growth in heating demand. Smart controls and thermal flexibility may help shift loads, and improved forecasting and monitoring may give planners earlier warning.
Some of these are established practices. Efficiency retrofits, appropriately sized equipment and detailed local assessments are well understood. Others are emerging. Widespread coordinated control of heat pump fleets, and tight integration of heating with renewable supply, depend on technology, tariffs, regulation and customer acceptance. Forecasts of adoption vary widely and are sensitive to energy prices, policy support, retrofit rates and climate conditions, so they should be treated as scenarios. For related technology, see smart grid vs traditional grid.
Conclusion: Planning for Heat Pump Electricity Demand
Heat pumps shift building heating demand onto the electricity system. Heat pump electricity demand has strong seasonal patterns, and cold-weather peaks are often the binding constraint for local transformers, feeders and substations. Equipment performance, building efficiency, supplementary heating and the existing network all shape the result, and the effect varies from place to place.
Accurate forecasting, efficient building design, suitable controls and timely distribution planning work together. Treat annual energy and peak power as separate questions, use local data wherever possible and update assumptions as installations and metering data arrive. Readers interested in the wider picture can continue with the AboutShrey.com articles on electricity demand, electrification and grid modernization.
Frequently Asked Questions About Heat Pump Electricity Demand
What is heat pump electricity demand?
It is the electrical power a heat pump draws, and the energy it uses over time, to provide heating or cooling.
Utilities consider both the power (kW) and the energy (kWh).
How does heat pump electricity demand work?
A heat pump uses electricity to run a compressor, fans and pumps that move heat into a building. The electricity needed depends on how much heat the building requires and how efficiently the unit delivers it.
Colder weather generally raises heat needs and can lower efficiency.
Why is heat pump electricity demand important?
It changes electricity use and winter peaks, which affects transformers, feeders, substations and utility planning.
It also affects building costs and the energy transition.
What are the main components of heat pump electricity demand?
Compressor power is the largest part, plus fans, circulation pumps and controls. Supplementary heating, defrost and hot-water heating can add more.
Building heat needs and weather set how much each runs.
What are the challenges of heat pump electricity demand?
Challenges include uncertain adoption, cold-weather coincident peaks, variable equipment performance, limited visibility of building loads and local network constraints.
Poorly insulated buildings and supplementary heating can make peaks larger.
Where is heat pump electricity demand used?
In utility load forecasting, distribution and substation planning, building and energy policy and equipment design.
It applies in homes, commercial buildings and some industrial and district heating.
Do heat pumps increase winter peak electricity demand?
They can, because they add electrical load for heating at cold times. The size of the effect depends on the buildings, equipment, weather and any supplementary heating.
Efficiency measures and controls can reduce it.
How does outdoor temperature affect heat pump electricity use?
Colder air raises the building’s heat needs, and for air-source units it can also reduce efficiency (COP). Both effects tend to raise electricity use.
Ground-source systems are generally less sensitive to air temperature.
What is the difference between heat pump electrical input and heat output?
Electrical input is the electricity consumed. Heat output is the useful heat delivered. The ratio is the COP.
A COP of 3 means three units of heat for each unit of electricity, because heat is moved and not generated.
Can heat pumps overload distribution transformers?
They can contribute to high loading where many are installed on one transformer and existing load is already high. It is not automatic.
Outcomes depend on ratings, existing load, weather and coincident operation, so each case needs local assessment.
How can utilities forecast heat pump electricity demand?
They combine load history, weather, building data, adoption scenarios and equipment performance, and use AMI and analytics to refine results.
They forecast annual energy and winter peak separately.
Can smart controls help manage heat pump loads?
Yes, to a degree. Scheduling, preheating and demand response can shift or reduce load.
They cannot always remove a cold-weather peak or replace needed network upgrades.

I share real stories, practical ideas and honest perspectives on business, marketing and life. This blog is a space to learn, grow and connect.


