
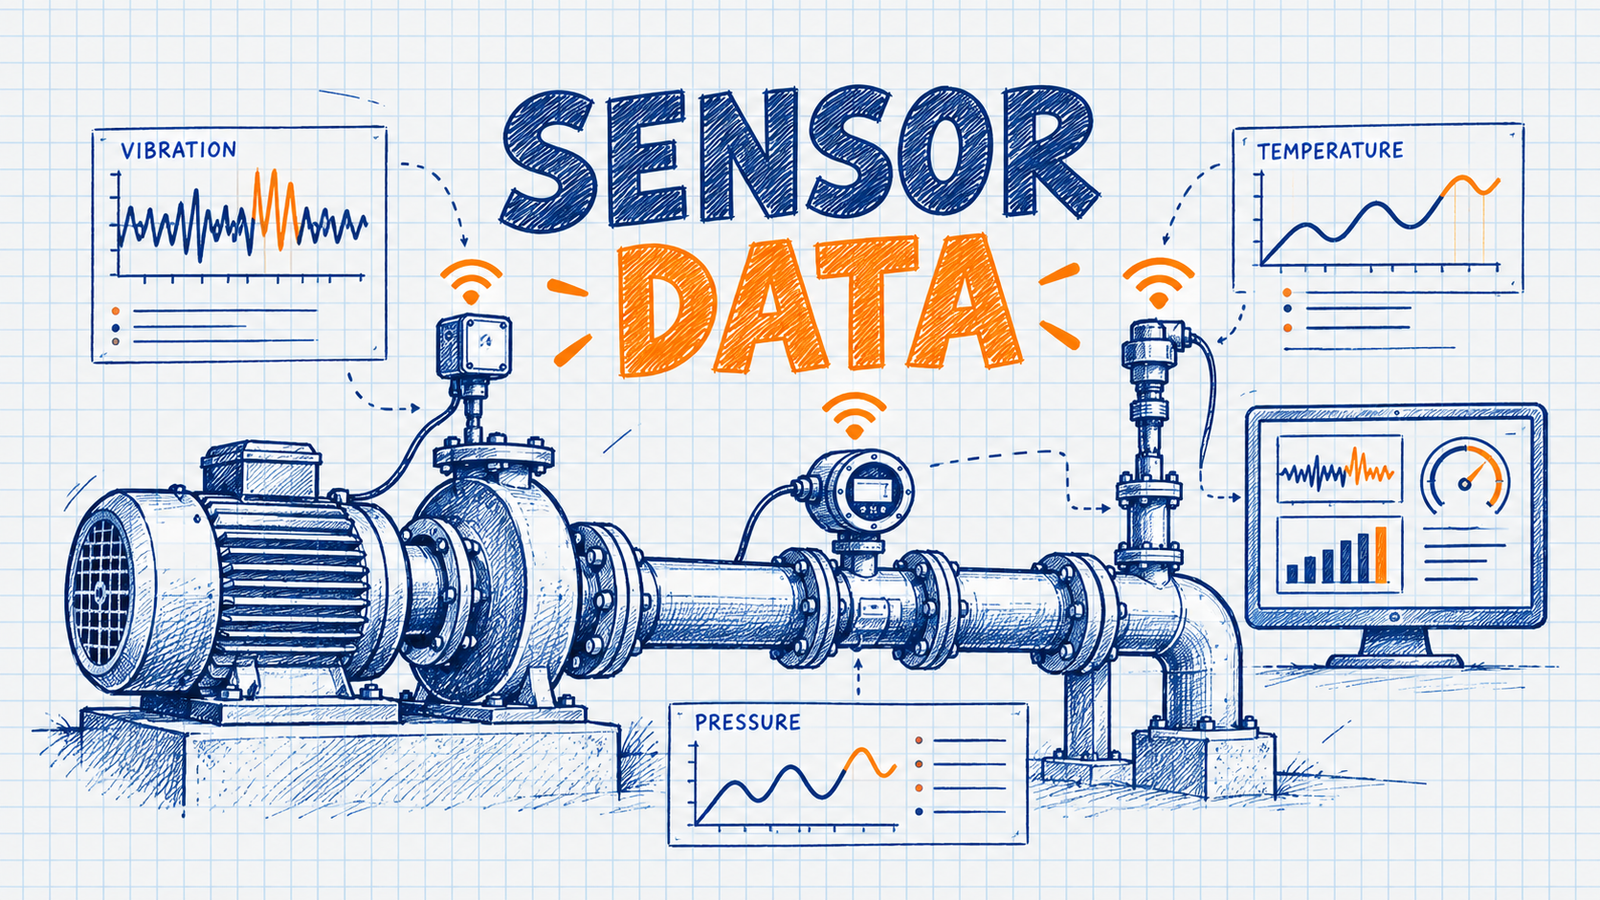
Sensor data supports predictive maintenance by continuously or periodically capturing equipment conditions, converting measurements into useful features, identifying abnormal trends or patterns, and generating alerts that can help engineers assess maintenance risk before failure occurs. In sensor data predictive maintenance, the sensor supplies evidence about condition. The decision still comes from analysis, engineering context and maintenance workflows.
This matters for modern utility asset management because assets such as transformers, breakers and switchgear are expensive, critical and often hard to inspect frequently. Sensors can provide visibility between inspections. Not every reading predicts failure, and a good program turns raw data into reliable, prioritized information. This article follows the journey from asset measurement to engineering decision, building on predictive maintenance for electric utilities.
Key Takeaway
- Sensors provide measurements about asset condition and operation.
- Condition monitoring turns measurements into useful asset information.
- Feature engineering converts raw data into meaningful indicators.
- Analytics and AI can identify abnormal patterns.
- Alerts help engineers prioritize investigation.
- Maintenance decisions should combine data with engineering judgment.
What Is Sensor Data for Predictive Maintenance?
Sensor data for predictive maintenance is measurement data from sensors on or near equipment, used to assess condition and estimate maintenance need or failure risk.
- Sensor data: raw measurements such as temperature or vibration.
- Condition monitoring: observing condition indicators over time.
- Predictive maintenance: acting on condition and predicted risk.
- Asset health: a summary of condition.
- Predictive alerts: notifications that condition or risk needs review.
- Anomaly detection: finding behavior that differs from expected behavior.
Physical Asset -> Sensor -> Measurement -> Data -> Condition Indicator -> Analysis
-> Alert -> Engineering Review -> Maintenance Decision
Sensor monitoring collects readings. Condition monitoring interprets them as asset condition. Predictive maintenance adds forward-looking risk and decisions. Failure prediction estimates the likelihood of a defined failure. They are related but not the same.
How Sensor Data Supports Predictive Maintenance
Asset -> Sensor -> Measurement -> Data Collection -> Communication -> Data Storage
-> Data Quality -> Feature Engineering -> Condition Assessment
-> Trend / Anomaly Detection -> Risk Assessment -> Alert -> Engineering Review
-> Maintenance Decision -> Work Order -> Maintenance Action -> Feedback
- Sensor and measurement: capture a physical quantity.
- Collection, communication and storage: move and retain the data.
- Data quality: validate before analysis.
- Features and assessment: compute indicators and judge condition.
- Trend and anomaly detection: find drift and unusual behavior.
- Risk and alert: weigh consequence and notify.
- Review, decision and work: engineers decide, and work is planned and done.
- Feedback: outcomes refine thresholds and models.
Types of Sensor Data Used in Utility Assets
Not every sensor applies to every asset.
| Data Type | Typical Asset / Application | What It Can Indicate | Predictive-Maintenance Value |
|---|---|---|---|
| Temperature | Transformers, switchgear, cables | Thermal stress, cooling issues | Trend and peak features |
| Vibration | Fans, pumps, motors, mechanisms | Mechanical wear or looseness | Change from baseline |
| Current | Most electrical assets | Loading, imbalance | Stress exposure |
| Voltage | Feeders, equipment | Supply conditions | Context for stress |
| Pressure | Gas-insulated and oil-filled equipment | Leaks or internal changes | Deviation detection |
| Humidity | Switchgear, enclosures | Moisture ingress risk | Environmental stress |
| Load | Transformers, feeders | Demand on the asset | Cumulative stress |
| Oil condition | Transformers | Insulating oil degradation | Condition trend |
| Dissolved gas analysis, where relevant | Oil-filled transformers | Possible internal thermal or electrical issues | Pattern features |
| Partial discharge, where relevant | Switchgear, cables, transformers | Insulation activity | Trend and intensity |
| Acoustic signals, where applicable | Various equipment | Discharge or mechanical noise | Pattern detection |
| Operating cycles | Breakers, tap changers | Wear accumulation | Usage-based risk |
| Position / state | Switches, breakers | Operational status | Event context |
| Environmental conditions | Outdoor assets | External stress | Context |
Temperature Data
Temperature monitoring covers equipment temperature, ambient temperature, temperature trends, thermal stress, load-related heating and abnormal temperature rise. A high temperature does not automatically mean failure. Interpret it against load, ambient conditions, cooling, asset type and the historical baseline. A reading that is normal at peak load on a hot day may be unusual at light load.
Vibration Data
Vibration data describes mechanical behavior through amplitude, frequency patterns and changes from baseline. It is most relevant for rotating or moving equipment, such as fans, pumps and motors in utility environments and mechanical equipment generally. Abnormal vibration can indicate potential mechanical problems such as wear or looseness. No universal vibration thresholds are given, since acceptable levels depend on the equipment and its standards.
Electrical Signals
Current, voltage, power, load, frequency and, where relevant, harmonics provide operational context. They show how hard an asset is working and under what conditions. Abnormal electrical behavior is most useful alongside other condition indicators. An overload explains a temperature rise, while a temperature rise with normal loading deserves closer attention.
Transformer Condition Data
Relevant signals include temperature, load, oil condition, dissolved gas analysis, moisture where applicable, bushing-related measurements where applicable, cooling-system status and maintenance history. Different monitoring architectures provide different visibility, ranging from basic temperature and load to extensive online monitoring.
Circuit Breaker and Switchgear Sensor Data
Useful signals include operation count, operating time, coil or current signatures where applicable, temperature, partial discharge where applicable, mechanical condition, trip and alarm history and inspection data. Combining them supports condition assessment. For example, slower operating time with a rising operation count and an earlier alarm pattern says more than any one value.
Data Collection Architecture
Sensors -> Edge Device / Gateway -> Communication Network
-> Data Collection Platform -> Storage -> Analytics
Possible communication technologies include Ethernet, fiber, cellular, RF, private utility networks, wireless sensor networks and industrial communication systems. Architecture depends on asset type, location, latency, bandwidth and reliability requirements. See smart grid communication networks.
SCADA, IoT and Sensor Data
- SCADA: operational measurements, equipment status, alarms and control information.
- IoT: connected sensors, additional condition measurements and distributed monitoring.
- Dedicated condition sensors: asset-specific measurements such as gas or partial discharge.
The sources complement one another. SCADA gives operating context, and dedicated sensors give condition detail. See IoT in smart grids.
Sensor Data Quality
Common problems are missing readings, duplicate records, incorrect timestamps, sensor drift, calibration problems, communication gaps, outliers, noise, unit inconsistencies and asset-ID mismatches.
Poor Sensor Data -> Poor Features -> Poor Analysis -> Unreliable Alerts -> Poor Maintenance Decisions
Data Cleaning and Validation
Typical steps are range checks, timestamp checks, missing-data detection, duplicate detection, sensor-status validation, outlier analysis, unit normalization, asset mapping and completeness checks. Validation should happen before predictive modeling, so a faulty sensor is not mistaken for a failing asset.
Feature Engineering
Raw measurements are often converted into features, such as mean, median, minimum, maximum, standard deviation, moving average, rolling standard deviation, rate of change, temperature rise, load duration, event count, alarm frequency, operating-cycle count, time since maintenance, deviation from baseline and trend slope.
| Raw Signal | Feature | Potential Interpretation |
|---|---|---|
| Temperature | 24-hour moving average | Longer-term thermal condition |
| Temperature and load | Temperature rise above ambient per load level | Cooling or loading behavior |
| Vibration | Change from baseline | Developing mechanical change |
| Alarms | Alarm count per week | Recurring problem |
| Operating time | Trend slope over operations | Gradual mechanism drift |
| Operations | Cycles since maintenance | Wear exposure |
These examples are illustrative.
Baselines and Normal Operating Behavior
Systems establish expected behavior through historical baselines, asset-specific baselines, operating-state baselines, seasonal effects, load-dependent behavior and environmental context. An unusual value is not necessarily a failure. Anomaly interpretation requires context.
Trend Analysis
Trend analysis looks at long-term and short-term trends, rate of change, persistent deviations, repeated excursions and gradual degradation.
Normal -> Small Deviation -> Persistent Deviation -> Elevated Risk -> Maintenance Assessment
This sequence is conceptual and does not always occur. Some failures develop abruptly with little warning.
Anomaly Detection
Approaches include rule-based detection with thresholds, statistical detection with expected ranges, and machine-learning detection using clustering, isolation-based methods or autoencoders where appropriate.
An anomaly is behavior that differs from expected behavior and may require investigation. An anomaly is not a failure. See AI equipment failure prediction.
Alerts and Alarm Generation
Conceptual framework. It is not a universal utility standard.
Informational -> Warning -> Elevated Condition -> High Risk -> Critical / Immediate Review
Alerts can be threshold alerts, trend alerts, multi-signal alerts, model-based alerts or persistent-condition alerts. Too many alerts cause alert fatigue, which reduces operational value. Good alert design prioritizes by risk and consequence.
Multi-Sensor Analysis
Combining signals adds context. Temperature plus load, ambient temperature and cooling status says more than temperature alone. Vibration plus temperature plus operating cycles gives broader mechanical condition information. Sensor fusion does not guarantee better prediction. It helps only when the added signals are reliable and relevant.
AI and Machine Learning
| Model | Typical Use | Strength | Limitation |
|---|---|---|---|
| Logistic regression | Failure-risk classification | Interpretable | Linear assumptions |
| Decision trees | Classification | Easy to explain | Can overfit |
| Random forests | Risk classification | Nonlinear patterns | Less transparent |
| Gradient boosting | Risk prediction | Strong on tabular data | Needs tuning |
| XGBoost / LightGBM | Structured features | High predictive potential | Complexity |
| Neural networks | Complex signals | Flexible | Data and compute needs |
| Time-series models | Degradation trends | Temporal structure | Assumptions |
| Anomaly detection | Unusual behavior | Needs few failure labels | Unusual is not failing |
| Survival models | Time to failure | Handles timing | Needs event data |
AI is optional, and predictive maintenance can also use engineering rules and statistical methods.
Sensor Data for Asset Health
Sensor measurements can contribute to a condition score, asset health score, anomaly score, risk score, failure probability and remaining useful life estimate.
Sensor Data -> Condition Indicators -> Asset Health -> Risk Assessment -> Maintenance Priority
Risk Indicators
Risk = Probability of Failure x Consequence of Failure
Probability depends on condition and failure mode. Consequence depends on asset criticality, customer impact, safety impact and operational impact. Actual utility risk frameworks can be more complex.
Predictive Alert Workflow
Sensor Reading -> Validation -> Feature Calculation -> Baseline Comparison
-> Anomaly Detection -> Risk Assessment -> Alert Generation -> Engineer Review
-> Asset Inspection -> Maintenance Decision -> Work Order -> Maintenance Action -> Feedback
Alerts should support decisions and should not automatically trigger unnecessary maintenance. An engineer reviews the evidence, and an inspection often confirms or dismisses it first.
Preventive vs Predictive Maintenance
| Aspect | Preventive | Predictive (Sensor-Based) |
|---|---|---|
| Trigger | Schedule | Condition and risk |
| Data requirement | Low | High |
| Monitoring | Not required | Periodic or continuous |
| Scheduling | Fixed | Adaptive |
| Typical workflow | Schedule, work order, service | Data, alert, review, work order |
| AI requirement | None | Optional |
| Asset suitability | Known intervals or mandates | Measurable degradation |
| Advantages | Simple, predictable | Condition-aware timing |
| Limitations | May over- or under-maintain | Data and validation needs |
Sensor-based predictive maintenance complements preventive maintenance and does not automatically replace it. See preventive vs predictive maintenance.
Utility Asset Applications
Transformers
Temperature, load, oil condition, gas analysis and cooling status support condition assessment and inspection prioritization.
Circuit Breakers
Operation count, timing and signatures support mechanism condition tracking.
Switchgear
Temperature, humidity and partial discharge support insulation and connection monitoring.
Distribution Transformers
Load and temperature data, where sensors exist, support population risk ranking. Many units have limited monitoring.
Motors and Pumps
Vibration, temperature and current support mechanical condition monitoring for auxiliary and cooling equipment.
Substation Equipment
SCADA, IED and condition sensor data support substation-wide asset monitoring. See digital substation architecture.
Transmission Assets
Monitoring of transformers, breakers and lines supports inspection scheduling and risk assessment.
Distribution Assets
Sparse sensors plus inspection and operational data support feeder and equipment prioritization.
Critical Electrical Infrastructure
Sensors on backup-power transformers, switchgear and UPS systems support maintenance planning and risk awareness for facilities such as data centers and hospitals.
AMI and Smart Meter Connection
AMI can provide meter events, consumption patterns, voltage-related data where available, communication status, outage and restoration signals and distribution-level operational context. AMI data is useful for distribution analytics, but smart meters are not substitutes for dedicated condition sensors on every utility asset. See head-end systems in AMI and meter data management systems.
Data Storage and Processing
Sensor -> Gateway -> Data Platform -> Time-Series Storage / Database -> Processing
-> Feature Store (where applicable) -> Analytics -> Dashboard / Alerting
Design choices include historical storage, real-time versus batch processing, time-series data handling, data retention and access control.
Real-Time vs Historical Sensor Data
Real-time data offers fast visibility, immediate alerts and operational response. Historical data supports trend analysis, baseline creation, model training and degradation analysis. Both are valuable, since real-time data drives alerts and history gives them meaning.
Model Training Using Sensor Data
Historical Sensor Data -> Data Cleaning -> Feature Engineering -> Failure / Condition Labels
-> Training Dataset -> Model Training -> Validation -> Testing -> Deployment -> Monitoring
Key issues are failure labels (which are often scarce), imbalanced datasets, time-based validation, data leakage and model drift. No performance figures are given.
Performance Metrics
- Classification: precision, recall, F1, ROC-AUC, PR-AUC and Brier score.
- Regression: MAE, RMSE and MAPE with caveats near zero values.
- Operational: alert-to-action time, prediction lead time, false positive rate, false negative risk, data completeness and asset monitoring coverage.
Accuracy alone is often insufficient when failures are rare.
Alert Fatigue and False Alerts
Problems include too many alerts, duplicates, low-value alerts, false positives, sensor faults and temporary abnormal conditions. Prioritizing by risk, suppressing duplicates, checking sensor health and adding context all improve usefulness.
Hypothetical Utility Scenarios
All scenarios below are illustrative and hypothetical. They are not real projects and contain no measured field results.
- Scenario 1, Transformer: temperature rise above ambient grows relative to load while oil-condition indicators change. An alert prompts engineers to review and schedule an inspection.
- Scenario 2, Circuit breaker: operating time drifts upward over successive operations. A trend alert leads engineers to inspect the mechanism and decide on servicing.
- Scenario 3, Distribution transformers: load and temperature features across a population rank units by risk, so inspection crews start with the highest-ranked units.
- Scenario 4, Data-center electrical equipment: monitoring on critical switchgear supports maintenance planning and risk awareness alongside scheduled tests. It does not guarantee uptime.
Business and Operational Value
Potential benefits include earlier identification of degradation, better maintenance prioritization, improved asset visibility, better workforce planning and scheduling, better spare-parts planning, reduced unexpected failure risk, better reliability planning and better asset lifecycle management. No ROI or savings are guaranteed.
Common Mistakes
- Installing sensors without a defined use case.
- Ignoring sensor calibration.
- Using poor-quality data.
- Treating every anomaly as failure.
- Using fixed thresholds without context.
- Ignoring asset criticality.
- Over-relying on AI and ignoring engineering validation.
- Creating too many alerts.
- Not integrating alerts with work management.
- Ignoring cybersecurity and model drift.
Challenges
Challenges include sensor cost, reliability and calibration, data volume and quality, communication reliability, legacy-system integration, cybersecurity, storage, model complexity, workforce skills, false positives and negatives, limited historical failures and changing operating conditions.
Implementation Roadmap
- Define the maintenance use case: choose the decision to support.
- Identify critical assets: focus on high consequence.
- Identify failure modes: link measurements to how assets fail.
- Select appropriate sensors: measure what the failure mode needs.
- Establish data architecture: communication, storage and processing.
- Implement data quality controls: validate and monitor sensors.
- Develop features: build trend and event indicators.
- Establish baselines: define normal behavior per asset and state.
- Build alerts and models: start with rules, add models where justified.
- Validate with engineers: test against known asset history.
- Integrate with maintenance workflow: connect alerts to work management.
- Monitor and improve: track alert quality and drift.
Future of Sensor-Based Predictive Maintenance
Current: condition monitoring, sensor networks, analytics, rule-based alerts and predictive models.
Emerging: edge analytics, more intelligent sensors, multimodal data, better asset health models and AI-assisted maintenance planning.
Future possibilities: real-time asset intelligence, digital twins, more autonomous decision support and integrated asset-management platforms. These are possibilities and not guarantees. See also AI-based predictive maintenance for utility assets and electric grid reliability.
Final Framework
Physical Asset -> Sensor -> Measurement -> Communication -> Data Quality
-> Feature Engineering -> Condition Monitoring -> Anomaly / Trend Analysis
-> AI / Analytics -> Asset Health -> Risk Indicator -> Alert
-> Engineering Validation -> Maintenance Decision -> Work Order
-> Maintenance Action -> Feedback
The feedback loop matters because inspection findings and maintenance outcomes show which alerts were useful. They refine baselines, thresholds and models over time, and without them a program cannot improve or prove its value.
Frequently Asked Questions About Sensor Data Predictive Maintenance
What is sensor data predictive maintenance?
Sensor data predictive maintenance uses measurements from sensors on equipment to assess condition, detect abnormal trends and estimate maintenance risk before failure. Measurements are converted into features, analyzed and turned into alerts that engineers review.
It provides evidence for maintenance decisions and does not guarantee failure prediction.
How does sensor data predictive maintenance work?
Sensors capture measurements that are collected, transmitted, stored and validated. Features such as trends and baseline deviations are calculated, and rules or models detect anomalies and estimate risk.
Alerts go to engineers, who review the evidence, inspect if needed and decide on maintenance. Outcomes are fed back to improve thresholds and models.
Why is sensor data predictive maintenance important?
It gives visibility into asset condition between inspections, helping utilities spot degradation earlier and prioritize maintenance. Potential benefits include better workforce and spare-parts planning and reduced unexpected failure risk.
Value depends on sensor quality, analytics and workflow integration, and no savings are guaranteed.
What are the main components of sensor data predictive maintenance?
The main components are sensors, communication and data collection, storage, data quality controls, feature engineering, baselines, anomaly and trend analysis, optional AI/ML models, asset health and risk indicators, alerts, engineering review and maintenance work management with a feedback loop.
What are the challenges of sensor data predictive maintenance?
Challenges include sensor cost, reliability and calibration, data quality and volume, communication reliability, legacy-system integration, cybersecurity and limited historical failures. False positives, alert fatigue, model drift, workforce skills and changing operating conditions also matter.
Engineering validation and clear alert prioritization help manage them.
Where is sensor data predictive maintenance used?
It is used on transformers, circuit breakers, switchgear, cables, motors and pumps, substation equipment and selected distribution assets. It also supports critical facilities such as data centers and hospitals for their electrical equipment.
Use depends on asset criticality, failure modes and the sensors and communication available.
What sensor data is used for predictive maintenance in electric utilities?
Common data includes temperature, vibration, current, voltage, load, pressure, humidity, oil condition, dissolved gas analysis, partial discharge, acoustic signals, operating cycles, position and state, and environmental conditions. SCADA measurements and alarms add operating context.
Which signals apply depends on the asset and failure mode, and not every asset has every sensor.
How does sensor data support AI-based predictive maintenance?
Sensor data provides the history and features that AI models learn from. Models such as gradient boosting, time-series and anomaly detection methods find patterns linked to degradation and estimate risk or health scores.
Data quality strongly affects results, and outputs are estimates that engineers validate. AI is optional, since rules and statistics can also work.

I share real stories, practical ideas and honest perspectives on business, marketing and life. This blog is a space to learn, grow and connect.


