
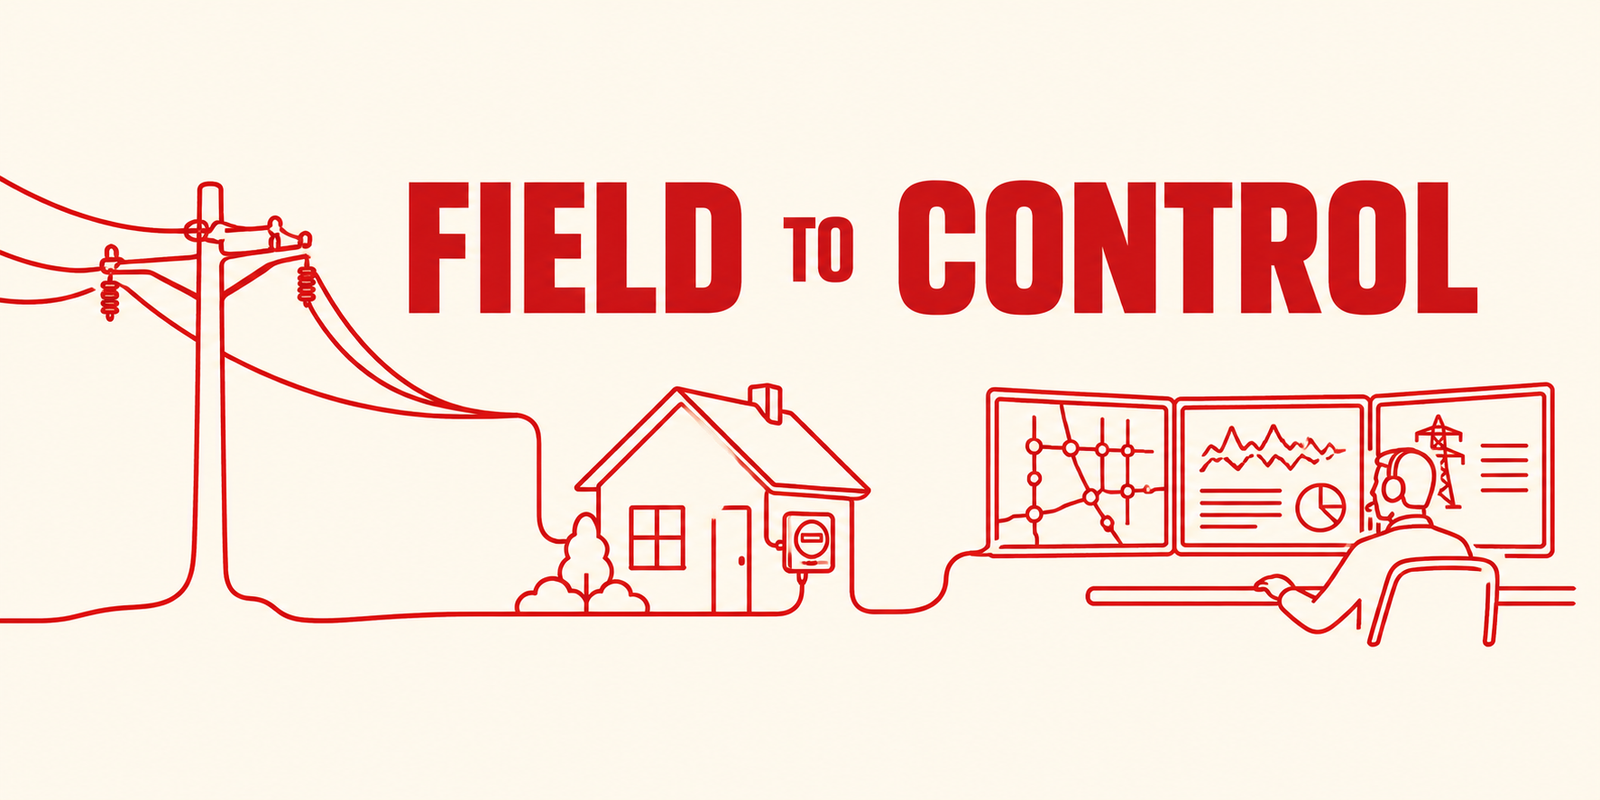
Smart grid technology works by turning physical grid conditions into data, moving that data to control and analytics systems, and sending decisions back to field equipment. So how does smart grid technology work in practice? A sensor, meter or relay measures a condition. Local devices collect it, a communication network carries it, utility systems organize it, analytics interpret it, and an operator or automation system acts on it. The next measurement shows whether the action worked.
The full journey runs from the physical grid condition to a sensor or device, then data collection, communication, a control platform, analytics, an operator or automation, and finally a grid action. A smart grid is not one device. It is an interconnected technology ecosystem made of smart meters, grid sensors, intelligent electronic devices (IEDs), remote terminal units (RTUs), IoT devices, communication networks, SCADA, distribution management systems (DMS), energy management systems (EMS), advanced metering infrastructure (AMI), data platforms, analytics, AI/ML, automation and utility control centers.
This article follows that workflow end to end. For the definition, read what is a smart grid. For old versus new networks, see smart grid vs traditional grid. For a device-by-device reference, see key components of a smart grid. Here the focus is how those parts work together.
Smart grid technology works by connecting field devices such as sensors, smart meters, IEDs and controllers to communication networks, control systems and analytics platforms, so utilities can monitor conditions, make decisions and apply automated or operator-controlled actions. The loop repeats continuously: measure, communicate, analyze, decide, act and measure again.
What Is Smart Grid Technology?
Smart grid technology is the set of hardware, communication infrastructure, software, control systems and analytics used to make electricity networks more observable, connected and controllable.
The two terms are related but different. The smart grid is the overall system, meaning the electricity network together with its digital layer. Smart grid technology refers to the technologies that enable its functions, such as sensors, meters, networks, control software and analytics. The technology sits on top of the physical power system. It does not replace lines, transformers or substations. The physical network is explained in our guide to electricity transmission and distribution.
How Does Smart Grid Technology Work?
The core idea is a closed loop. The workflow below has eight steps, and the sections that follow explain each in detail.
Field conditions change
Load, generation, weather, faults or equipment condition shift.
Sensors and devices measure conditions
Meters, sensors and IEDs convert physical changes into data.
Local devices collect and process information
IEDs, RTUs, PLCs and gateways gather, filter and act locally.
Communication networks transmit data
Fibre, RF mesh, cellular or private networks carry it onward.
Utility systems receive and organize the data
SCADA, AMI, DMS, EMS and data platforms store and present it.
Analytics identify conditions and trends
Tools compare current data with history, limits and forecasts.
Operators or automation make decisions
People or configured logic choose a response.
Control actions are sent back to field equipment
Commands operate switches, regulators, storage or other devices.
Each step depends on the one before it. The smart grid begins with physical measurements, and it ends with physical action.
Step 1: Field Devices Measure the Grid
The smart grid begins with physical measurements. Field devices sit on lines, transformers, switchgear, substations and customer premises.
| Field device | What it broadly measures or controls |
|---|---|
| Voltage sensors | Voltage level at lines, feeders or equipment |
| Current sensors | Current flow and loading |
| Temperature sensors | Equipment or conductor temperature |
| Power-quality sensors | Disturbances, harmonics and sags |
| Fault indicators | Passage of fault current on a line section |
| Transformer monitoring | Loading and condition indicators |
| Smart meters | Customer usage and events |
| IEDs | Protection, measurement and control at substations |
| RTUs | Field data collection and remote commands |
| PLCs | Local logic-based equipment control |
| DER monitoring devices | Output and status of solar, storage or EV chargers |
Our article on how sensors, IoT devices and intelligent monitoring are changing grid operations covers these devices in more depth.
Step 2: Sensors and Smart Meters Collect Data
Grid sensors
Grid sensors measure voltage, current, temperature, frequency, power quality, equipment condition and fault conditions. They are placed where the utility needs network-level or equipment-level visibility.
Smart meters
Smart meters work mainly at customer and service points. They record electricity consumption and meter events, and, where supported, outage information, voltage information and other measurements.
Combining the two gives a fuller picture. Sensors show what is happening on the network, while meters show what is happening at the edge. Together they help utilities connect a feeder-level voltage change to customer-level conditions. Neither one alone gives complete visibility.
Step 3: IEDs, RTUs and Local Controllers Process Information
Some processing and control happens close to the equipment rather than only at a central control center.
IEDs
An IED is a microprocessor-based device that performs protection, measurement, monitoring, control and event recording. A digital relay is a common example. It can detect a fault and trip a breaker in a very short time, then record what happened.
RTUs
An RTU collects field data and equipment status, communicates remotely and receives control commands. It links a remote site to the control center.
PLCs
A programmable logic controller (PLC) runs local logic and controls equipment, often for sequencing and interlocks. It is not the same as SCADA, which supervises many sites.
Local processing matters because protection must act in fractions of a second, and some actions cannot wait for a round trip to a control center. The control center, in turn, receives the results.
Step 4: Communication Networks Move the Data
Data travels from field devices to utility systems over communication networks. Utilities usually combine several technologies, using gateways and edge devices at the boundaries.
| Communication Method | Typical Use | Main Strength | Key Consideration |
|---|---|---|---|
| Fibre | Substations and backbone links | High bandwidth and low latency | High installation cost |
| Cellular | Scattered field devices | Wide coverage, quick deployment | Reliance on a third-party network |
| RF mesh | Meters and distribution devices | Self-forming local networks | Limited bandwidth, coverage gaps |
| Private networks | Critical utility data | Utility control of performance | Cost and spectrum needs |
| Wireless links | Short-range and remote sites | Flexible and low cost | Range and interference |
Six factors guide the choice:
- Latency: Protection signals need very low delay, while meter reads tolerate more.
- Reliability: Critical functions need dependable, often redundant, paths.
- Coverage: Rural, urban and indoor sites behave differently.
- Bandwidth: Continuous sensor streams need more capacity than periodic readings.
- Cost: Capital and operating costs differ widely.
- Security: Authentication and encryption must be designed in.
Step 5: Gateways and Edge Computing
A gateway sits between field devices and higher-level systems. It can:
- Collect readings from multiple devices
- Translate communication protocols
- Filter information
- Forward data to the right system
- Connect field devices with higher-level platforms
Edge computing means processing data close to where it is generated. Benefits can include lower latency, local event processing, reduced dependence on communication links, less data transmission and faster local decisions. Not every smart grid system requires edge computing, and many deployments process most data centrally. The right choice depends on latency needs, communication cost and system design.
Step 6: SCADA Receives and Displays Grid Information
SCADA, or Supervisory Control and Data Acquisition, is a system that collects data from field equipment, shows it to operators and allows remote supervisory control.
SCADA provides data acquisition, remote monitoring, equipment status, alarms, control, substation monitoring and control-room visualization. The flow is:
Field devices
Measure and report status.
RTU, IED or gateway
Collects and formats the data.
Communication network
Carries it to the control center.
SCADA
Stores, alarms and displays it.
Operator
Interprets the display and decides.
SCADA is also used in conventional utility environments, and its presence does not by itself make a grid a fully smart grid. What changes in a smart grid is the reach, integration and richness of the data around it.
Step 7: AMI and Smart Meter Data
AMI is the broader system around smart meters. Its data path is:
Smart meter
Records usage and events.
Communication network
Carries the readings.
Head-end system
Manages meter communication.
Meter data management
Validates and stores readings.
Utility applications
Use the processed data.
AMI can support billing, consumption analysis, outage information, load analysis, customer information, demand response and, where supported, voltage visibility. The distinction is simple: a smart meter is a field device, while AMI is the broader metering communication and data ecosystem.
Step 8: DMS and EMS Process Grid Information
DMS
A distribution management system is primarily distribution-focused. Its functions can include distribution monitoring, network visualization, switching, fault management, voltage management, distribution automation and DER coordination.
EMS
An energy management system is primarily transmission and generation-focused. Its functions can include system monitoring, load forecasting, generation coordination, power-system analysis and operational decision support.
| System | Primary Area | Main Role | Example Data Sources |
|---|---|---|---|
| SCADA | Substations and networks | Supervision and remote control | RTUs, IEDs, gateways |
| DMS | Distribution feeders | Distribution operations and automation | SCADA, sensors, smart meters, field devices |
| EMS | Transmission and generation | System monitoring and analysis | SCADA, generation data, forecasts |
| AMI | Customer connection points | Meter data collection | Smart meters |
SCADA, DMS and EMS are layered. SCADA provides the data and control interface, while DMS and EMS apply network models and applications on top of it.
Step 9: Data Platforms and Analytics
Smart grid data comes from smart meters, sensors, SCADA, IEDs, AMI, DMS, EMS, DERs, weather systems and asset systems. A data platform brings these sources together. The processing path is:
Raw data
Readings arrive in many formats and rates.
Validation
Errors, gaps and duplicates are detected.
Storage
Real-time and historical data are kept.
Processing
Data is combined and aligned in time.
Analytics
Trends, limits and patterns are evaluated.
Insight
Results reach engineers and operators.
Not every utility uses cloud platforms. Many keep processing in utility-owned data centers or at the edge. For more on this layer, see why grid modernization depends on better electricity data and real-time visibility.
Step 10: AI and Machine Learning
AI/ML is one layer in the analytics stack. Typical applications include:
- Load forecasting and demand forecasting
- Renewable and DER forecasting
- Anomaly detection
- Asset health and predictive maintenance
- Fault analysis and outage analysis
- Operational decision support
AI does not automatically control the entire grid. Its outputs generally need data validation, model validation, engineering review, operational rules and human oversight. Predictive tools estimate risk and do not guarantee outcomes. Claims of fully autonomous grids are not supported by current practice.
Step 11: Operators Make Decisions
Digital systems support human decision-making, and operators and engineers remain central. Operators may:
- Review alarms and check equipment status
- Analyze grid conditions and confirm faults
- Change switching states
- Coordinate field crews
- Review forecasts
- Manage abnormal conditions
Good displays, accurate network models and clear procedures help operators decide quickly and safely.
Step 12: Automation Sends Actions Back to the Grid
The closed-loop concept is: measure, communicate, analyze, decide, act and measure again. Automation examples include:
- Automated switching and reclosers
- Voltage regulation
- Fault isolation and FLISR (fault location, isolation and service restoration)
- Demand response
- DER control
Automated actions operate according to configured logic, protection settings and operational rules. They do not replace protection systems or operator supervision. Our guide to power system automation covers this loop in depth.
Smart Grid Technology: Complete Data Flow
The complete flow connects every step above into one loop:
Field
The physical grid changes.
Sensors, smart meters, IEDs and RTUs
Measure and collect.
Gateways and edge devices
Translate, filter and process locally.
Communication networks
Transport the data.
SCADA, AMI, DMS and EMS
Receive and present it.
Data platform
Validates and stores it.
Analytics, AI and forecasting
Interpret it.
Operator or automation
Decides.
Control command
Travels back over the network.
Field device
Operates equipment.
New measurement
Confirms the result and restarts the loop.
The feedback loop is what makes the system more than a monitoring tool. Without the final step, the utility would act but never learn whether the action worked. A new measurement can show that voltage returned to range, or that more action is needed. The same data is stored for planning and maintenance, so the loop also improves long-term decisions. If any link breaks, such as a failed communication path, the utility loses visibility or control at that point and must rely on local protection and manual procedures.
How Smart Grid Technology Works in a Substation
A typical substation flow is: substation equipment, sensors, current and voltage transformers (CTs and VTs) and IEDs, local controllers, station network, SCADA or control system, and finally the operator.
- Protection: IEDs detect faults and trip breakers locally.
- Measurement: CTs and VTs supply current and voltage signals.
- Monitoring: Equipment condition and status are tracked.
- Automation: Local logic handles switching sequences.
- Communication: A station network links devices to the control system.
Digital substations extend this approach with digital measurement and standard communication. Read digital substations: architecture, automation, communications and operational benefits for the details.
How Smart Grid Technology Works on a Distribution Feeder
A feeder flow is: feeder, sensors, smart meters, automated switches, communication, DMS, and then an operator or automation.
- Voltage monitoring: Sensors and meters show voltage along the feeder.
- Fault detection: Fault indicators and relays locate faulted sections.
- Feeder loading: Current and meter data show how heavily the feeder is used.
- Switching: Remote switches reconfigure the feeder.
- DER visibility: Solar and storage output become visible to operators.
- Outage management: Meter and device events help locate and verify outages.
How Smart Grid Technology Supports Renewable Energy
Solar, wind, distributed generation and battery storage change how power flows. Output varies with weather, and local generation can alter voltage and loading on feeders. Variable generation therefore needs better measurement, forecasting, communication, flexible resources and grid control.
Smart grid technology supports these needs, but it does not solve renewable integration on its own. Network reinforcement, planning, market rules and protection design still matter.
How Smart Grid Technology Supports Electric Vehicles
EV charging adds demand that can be large and clustered. Established tools include smart charging, load forecasting, distribution monitoring and managed charging, in which charging is scheduled or limited by signals or programs. Vehicle-to-grid, in which vehicles export energy, is an emerging capability that is being explored and piloted but is not yet widespread. Keeping these two groups separate avoids overstating what is available today.
How Smart Grid Technology Supports Energy Storage
A storage system reports state of charge, power output and charging or discharging status. Monitoring and dispatch let utilities use it for peak support, renewable balancing and grid flexibility. None of this works without communication and control. The storage system needs reliable data links to receive schedules or signals and to report back, and its operation must respect equipment limits and safety rules.
Smart Grid Technology and Grid Automation
Grid automation is the action end of the workflow: sensors, communication, control system, automation logic and field action. It covers distribution automation, automated switching, fault isolation, restoration, voltage control and DER coordination. Automation depends on trustworthy measurements and communication, so it is the part of smart grid technology that exposes weaknesses in the earlier steps fastest.
Smart Grid Technology and Grid Modernization
Smart grid technology is one of the major technology layers supporting grid modernization. The terms are related but not synonyms. Grid modernization is the broader effort to upgrade equipment, practices and data, and it also includes physical reinforcement. Related topics include grid sensors, digital substations, power system automation, the future electric grid and smart grid components.
Cybersecurity in Smart Grid Technology
Connecting more field devices increases the importance of protecting them. Defensive practices include:
- Authentication and access control: Verify users and devices and limit privileges.
- Network segmentation: Separate operational networks from business systems.
- Secure communication: Protect data in transit.
- Monitoring: Watch for unusual activity.
- Software updates and device management: Apply tested updates and keep device inventories current.
- Incident response, backup and recovery: Prepare, rehearse and verify restoration.
- Operational technology (OT) security: Account for long-lived field equipment.
Data Quality and Smart Grid Technology
More data does not automatically mean better decisions. The chain is simple: bad data leads to bad analysis, which leads to bad decisions. Data quality depends on:
- Accuracy and calibration: Sensors must measure correctly over time.
- Timestamping and synchronization: Events must line up across devices.
- Missing data and communication failures: Gaps need detection and handling.
- Validation: Implausible values must be flagged.
- Data governance: Ownership, access and retention need clear rules.
- Cybersecurity: Data integrity must be protected.
Challenges of Smart Grid Technology
| Challenge | Why It Matters | General Response |
|---|---|---|
| Legacy infrastructure | Older equipment may not connect easily | Retrofit or replace by priority |
| Communication reliability | Data and control depend on links | Redundancy and suitable technology |
| Interoperability | Mixed suppliers and protocols | Open standards and testing |
| Data quality | Poor data weakens decisions | Validation and governance |
| Cybersecurity | More endpoints add exposure | Layered, defensive security |
| Device maintenance | Field devices need upkeep | Inventories and managed updates |
| Large data volumes | Storage and processing demands grow | Edge filtering, scalable platforms |
| Installation cost | High upfront investment | Phased, value-led deployment |
| Workforce skills | Teams need power, data and network skills | Training and mixed teams |
| Integration complexity | Many systems must exchange data | Clear architecture planning |
| Privacy | Meter data can reveal behavior | Data minimization and access control |
| Environmental conditions | Heat, moisture and weather affect devices | Rated equipment and inspection |
Benefits of Smart Grid Technology
These benefits are possible, not automatic, and depend on design, integration and operation.
| Capability | Operational Benefit |
|---|---|
| Real-time visibility | Faster awareness of network conditions |
| Better fault detection | Quicker location of problems |
| Automation | Faster response within configured rules |
| Better asset monitoring | Condition information for equipment |
| Renewable integration | Monitoring and forecasting support |
| DER coordination | Visibility and control options for local resources |
| Load visibility | Clearer view of demand patterns |
| Demand response | Flexible demand to ease peaks |
| Maintenance planning | Better targeting of work |
| Data-driven decision-making | Planning and operations backed by data |
Illustrative Example: Smart Grid Technology in Action
Illustrative example — not a real utility case study.
A distribution feeder has rooftop solar, battery storage, EV charging, smart meters, grid sensors and automated switches. In the early evening, solar output falls while EV charging rises.
A sensor detects changing voltage
Voltage drops toward the lower limit on part of the feeder.
Smart meters show changing demand
Customer usage rises as solar export falls.
Data travels through the communication network
Mesh and fibre links carry it to central systems.
The DMS receives the information
Operators see an updated feeder view.
Analytics identify a potential operating issue
The trend suggests voltage may leave its range.
An operator reviews the condition
The operator confirms the cause and options.
Automation responds where configured
Voltage equipment adjusts within set limits.
Storage or flexible resources may support the system
The battery may discharge or charging may be moderated.
Sensors verify the resulting condition
New readings show whether voltage recovered.
Smart Grid Technology vs Traditional Grid Technology
For the wider architectural comparison, see smart grid vs traditional grid.
| Area | Traditional Approach | Smart Grid Technology |
|---|---|---|
| Measurement | Key points, periodic readings | Wide coverage, interval data |
| Communication | Mainly to major sites | Two-way, extended to the edge |
| Data | Limited and siloed | Integrated platforms |
| Monitoring | Major substations | Feeders, equipment and customers |
| Control | Local and manual | Remote and centralized |
| Automation | Limited | Remote and automatic functions |
| Maintenance | Time-based and reactive | Increasingly condition-based |
| DER integration | Limited visibility | Monitoring and coordination |
| Renewable integration | Harder to manage at scale | Forecasting and monitoring support |
| Customer visibility | Limited | Detailed usage and event data |
| Analytics | Periodic studies | More continuous analytics |
Future of Smart Grid Technology
This is an informed outlook, not a guarantee, and developments will differ by utility and region.
- More connected field devices: Coverage is expected to widen.
- Advanced AMI: Meters could take on more grid-edge functions.
- More edge computing: More processing may move closer to devices.
- AI-assisted operations: Decision support may grow, with human oversight.
- Digital twins: Virtual network models are emerging for planning and operations.
- More DERs, storage and EVs: Local resources may keep growing.
- More automated distribution: More defined tasks could be automated.
- Improved interoperability: Standards work could ease integration.
- Advanced grid analytics: Forecasting and analysis tools are likely to improve.
Conclusion
Smart grid technology works as one workflow: field devices and sensors measure, communication networks carry the data, SCADA, AMI, DMS and EMS organize it, data platforms and analytics interpret it, operators or automation decide, and control commands drive the field response. New measurements then close the loop.
The real strength of smart grid technology comes from connecting these layers into one coordinated operational ecosystem, with good data, secure communication and engineers in the loop. For the wider context, explore grid digitalization and the future electric grid.
Frequently Asked Questions About Smart Grid Technology
What is smart grid technology?
Smart grid technology is the hardware, communication infrastructure, software, control systems and analytics that make electricity networks more observable, connected and controllable. It includes sensors, smart meters, IEDs, networks, SCADA, DMS, EMS and analytics. The smart grid is the overall system, and these technologies enable its functions.
How does smart grid technology work?
Field devices measure grid conditions, and local devices collect the data. Communication networks carry it to systems such as SCADA, AMI, DMS and EMS, where platforms and analytics interpret it. Operators or configured automation then send actions back to field equipment, and new measurements confirm the result.
Why is smart grid technology important?
It gives utilities visibility and control that older networks often lacked. This matters as DERs, renewable energy, EVs and aging assets make operation more complex. Its benefits depend on integration, data quality and cybersecurity.
What are the main components of smart grid technology?
The main components are sensors, smart meters, IEDs, RTUs and PLCs in the field, plus gateways and communication networks. Control systems such as SCADA, DMS and EMS, AMI, data platforms, analytics and automation sit above them. Cybersecurity protects all of these layers.
What are the challenges of smart grid technology?
Key challenges include legacy infrastructure, communication reliability, interoperability, data quality and cybersecurity. Cost, device maintenance, workforce skills, privacy and integration complexity also matter. Utilities usually respond with phased deployment, open standards, data governance and layered security.
Where is smart grid technology used?
It is used across generation, transmission, substations, distribution feeders and customer premises. Meters sit at customer connections, sensors and automated switches on feeders, and IEDs and RTUs at substations. Control centers run SCADA, DMS and EMS, and adoption varies by utility and region.
How do sensors and smart meters support smart grid technology?
Sensors measure network and equipment conditions such as voltage, current and temperature. Smart meters record usage and events at customer connections, and some report voltage or outage information. Together they give utilities visibility from the feeder to the customer.
How do SCADA, DMS and EMS work together in a smart grid?
SCADA collects field data and provides remote monitoring and control. DMS applies network models and applications to distribution operations, while EMS does the same for transmission and generation. They share data, so operators see a consistent picture across voltage levels.

I share real stories, practical ideas and honest perspectives on business, marketing and life. This blog is a space to learn, grow and connect.


