
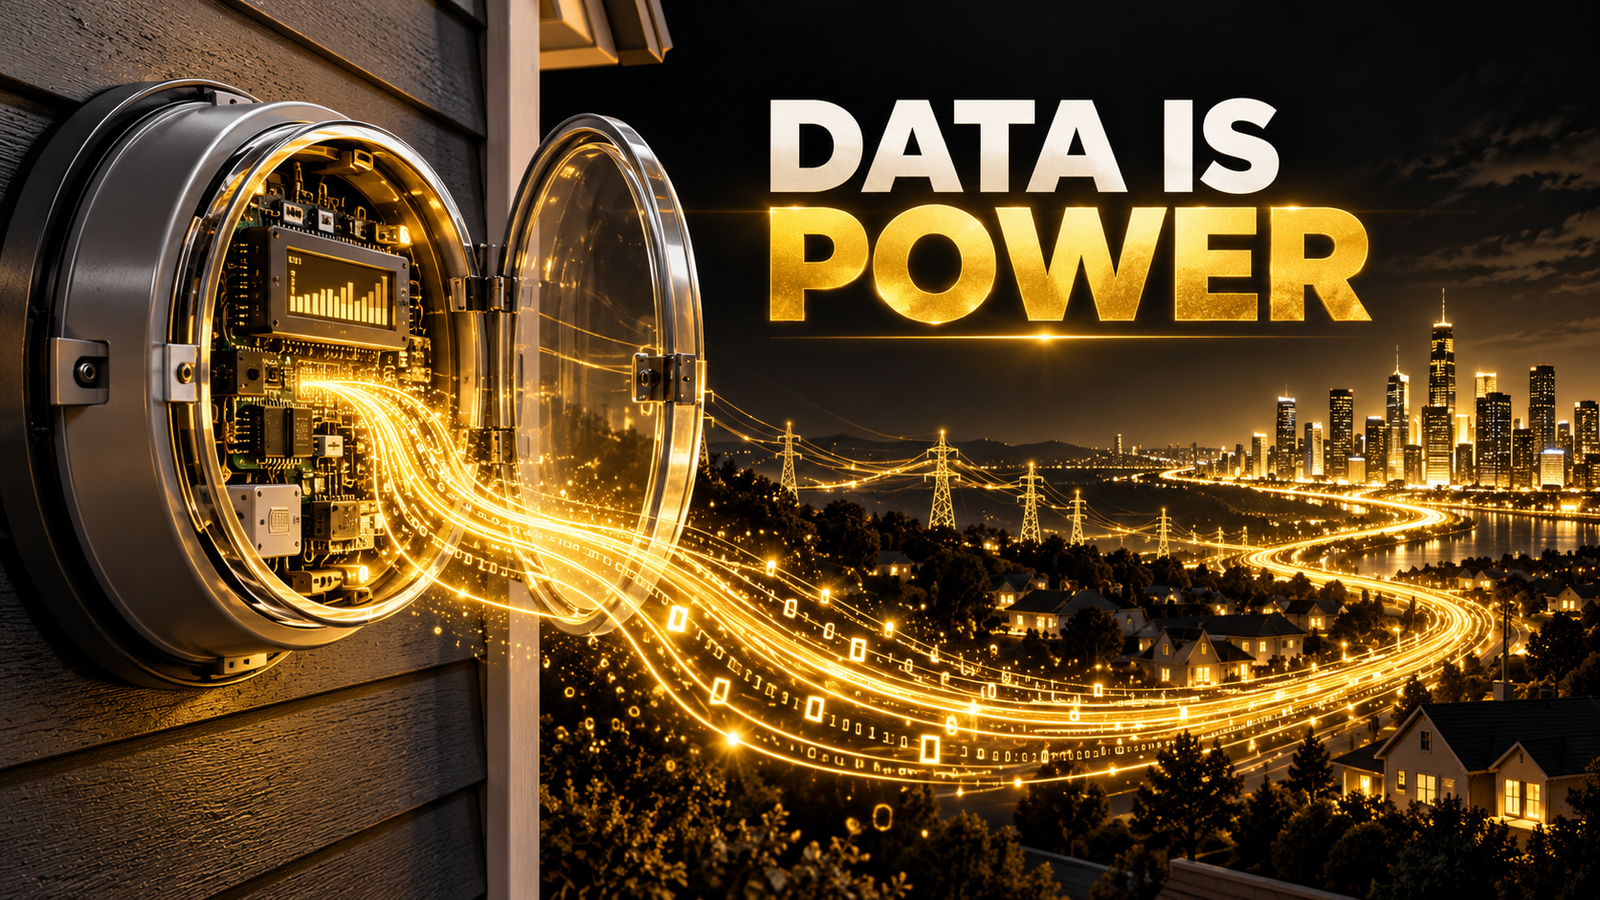
Introduction: Why Electricity Data Is Becoming More Important
Electricity data is the information produced by every part of the power system: meters recording how much energy customers use, sensors measuring voltage and current, generators reporting output, protection devices logging events and maintenance crews recording what they find in the field. For most of the history of the power industry, much of this information was collected slowly, stored in separate places and used mainly for billing and after-the-fact analysis. That is changing. Networks are being modernized, new loads and generation are being connected, and the tools for analyzing large datasets have become far more accessible.
As a result, electricity data is moving from a by-product of operations to a working asset that supports planning, operations, maintenance and business decisions. This article explains what electricity data is, where it comes from, how it is used and why its importance is growing for utilities, engineers and energy businesses. It is written for electrical engineers, engineering students, technology leaders, researchers and industry professionals. It does not quote statistics or performance gains, because outcomes depend on each system, and it separates established practice from potential applications and from the clearly labeled hypothetical example later in the article. For a related look at the role of visibility, see why grid modernization depends on better electricity data and real-time visibility.
What Is Electricity Data?
Electricity data is any recorded information about the generation, delivery, consumption, condition or economics of electrical energy. It includes measurements of physical quantities, records about equipment and events, and business information such as prices and customer accounts.
It helps to distinguish four stages, because confusing them is a common source of error:
- Raw measurements. Values as recorded by a device, such as a meter register reading or a voltage sample, along with their timestamps.
- Processed datasets. Measurements that have been validated, cleaned, aligned in time, linked to equipment and customers, and stored in a consistent structure.
- Analytics. Calculations, models and visualizations built on processed data, such as load profiles, forecasts or anomaly scores.
- Operational decisions. Actions taken by qualified people, such as reinforcing a feeder, scheduling an inspection or changing an operating arrangement.
Each stage depends on the one before it. A decision is only as sound as the analytics beneath it, and the analytics are only as sound as the data they were built from.
How Electricity Data Is Generated, Collected and Used
Data is generated at many points: at generation sites, in substations, along feeders, at customer premises and in market and business systems. It travels through communication networks to the systems that store and use it. A simplified flow looks like this:
- Measurement. Meters, current and voltage transformers, sensors and intelligent electronic devices measure electrical quantities and record events.
- Communication. Data is sent over fiber, cellular, radio or other links to central systems. See smart grid communication networks.
- Storage and management. Systems such as SCADA historians, meter data management platforms and enterprise databases store, validate and organize the data. See how utilities store smart meter data.
- Analysis. Engineers and analysts examine the data with simulation, statistics and machine learning.
- Action. Results feed operations, planning, maintenance, customer service and business decisions.
Three technical properties shape what any dataset can be used for. The sampling frequency (how often a value is recorded) determines which phenomena can be seen. The timestamp (when the value was recorded, and in which time reference) determines whether different sources can be compared. And completeness (how many expected values are present) determines how much confidence an analysis deserves.
Why Electricity Data Matters to Modern Power Systems
A power system must balance supply and demand continuously while keeping voltage and frequency within acceptable limits and protecting equipment. Decisions about this balance depend on knowing what is happening and what is likely to happen. Electricity data provides that knowledge. Specifically, it helps to:
- see the present state of the network, including loading, voltage and equipment status;
- understand past behavior, so planners can judge capacity and reliability;
- anticipate future conditions through forecasting;
- detect problems early, such as unusual equipment behavior or abnormal readings;
- support business processes such as billing, settlement and program design.
The need is growing because networks are becoming more complex. Variable generation, new loads such as electric vehicles and heat pumps, and customer-owned equipment make the system less predictable from history alone. Better data helps engineers manage that uncertainty, although it does not remove it.
Main Types of Electricity Data
Electricity data covers several families of information. Each serves different needs and has its own strengths and limitations.
Electricity Consumption and Demand Data
This is information about how much energy customers use and when. Energy (measured in kilowatt-hours) is the total used over a period, while demand (measured in kilowatts) is the rate of use at a moment or averaged over an interval. Peak demand often matters more for network capacity than total energy. Interval data shows how consumption varies through the day and across seasons.
Voltage, Current, Frequency and Power Measurements
These are the core electrical quantities. Voltage and current describe the electrical state at a point, frequency reflects the balance between generation and load across an interconnected system, and real and reactive power describe how energy and reactive support flow. SCADA systems typically sample these every few seconds, while specialized devices such as phasor measurement units record time-synchronized measurements much more frequently. The right resolution depends on the question, since slow data cannot show fast disturbances.
Generation and Renewable Energy Data
Generation data covers output, availability and operating limits of power plants, and for renewable resources, the weather conditions that drive output, such as solar irradiance and wind speed. Because solar and wind output varies, this data is central to forecasting and to scheduling other resources.
Transmission and Distribution Network Data
This includes network topology (how equipment is connected), switching status, feeder and transformer loading, protection events, fault records and outage information. Topology data is especially important because it links measurements to physical locations. Errors in connectivity records can make otherwise good measurements misleading. See transmission versus distribution networks for how these networks differ.
Smart Meter and Advanced Metering Infrastructure (AMI) Data
Advanced Metering Infrastructure (AMI) is the combination of smart meters, communication networks and data systems that collects and manages meter data. It supplies interval consumption, events such as outages and tamper flags, and in some deployments voltage readings. See smart meter data explained and what information a smart meter generates.
Equipment Condition, Inspection and Maintenance Data
This covers test results, online monitoring signals, inspection findings, maintenance history and asset records such as age, rating and location. It is often a mix of structured data and free-text notes, which makes consistent interpretation harder. For related methods see using sensor data for predictive maintenance.
Market, Pricing and Operational Data
Where electricity markets exist, price, bid, dispatch and settlement information is also electricity data, and it influences how generation and flexible demand are scheduled. Operational data such as work orders, outage logs and switching records complete the picture by showing what was done and when. The structure of markets and the data they publish differs greatly between regions.
| Data type | Typical use | Common limitation |
|---|---|---|
| Consumption and demand | Load profiling, forecasting, planning | Interval length hides short peaks |
| Voltage, current, frequency, power | Monitoring, protection, power quality | Sampling rate may be too slow for fast events |
| Generation and renewable | Scheduling, forecasting, integration studies | Depends on weather data quality |
| Network data | Planning, outage analysis, switching | Connectivity records may be out of date |
| Smart meter and AMI | Billing, analytics, outage awareness | Missing reads, privacy constraints |
| Equipment condition | Maintenance planning, risk assessment | Inconsistent formats, incomplete history |
| Market and operational | Dispatch, settlement, process review | Varies by region and market design |
The Role of Smart Meters and AMI in Electricity Data Collection
Smart meters changed the scale of electricity data collection. A traditional meter produced a few readings a year. A smart meter records consumption at regular intervals, commonly fifteen minutes to an hour though practice varies, and reports events. Together with the communication network, head-end system and meter data management system, it forms a continuous data pipeline. See Advanced Metering Infrastructure and AMI data flow explained.
The head-end system manages communication with meters, while the meter data management system validates, estimates and stores readings and passes them to billing and analytics. See HES versus MDMS for the distinction. For engineers, the key point is that AMI data has been through several processing steps before it reaches analysis. Understanding those steps helps explain gaps, estimates and unusual values. Common data problems are described in common smart meter data problems.
How Utilities Use Electricity Data for Planning and Operations
Utilities use electricity data across two broad timescales.
Operations work in real time or near real time. Examples include monitoring voltage and loading, detecting and locating outages, managing switching and responding to alarms. See how utilities detect power outages.
Planning works over months and years. Examples include deciding where to reinforce feeders or replace transformers, assessing whether new loads can be connected and evaluating reliability. See how utilities plan future grid capacity.
Between the two lie processes such as maintenance scheduling, loss analysis, customer programs and regulatory reporting. In all of them the usefulness of data depends on whether it reaches the right person in a trustworthy, understandable form at the right time.
Electricity Data and Smart Grid Modernization
A smart grid adds sensing, two-way communication, automation and analytics to the electrical network. Electricity data is what connects these elements. Sensors and meters produce it, communication systems carry it, automation and control systems act on it and analytics extract insight from it. See what a smart grid is and why smart grids need real-time electricity data.
Modernization projects often reveal that the main constraint is not the absence of data, but the difficulty of using it: different systems, inconsistent identifiers and uneven quality. Progress in grid modernization therefore depends as much on data management and integration as on new equipment. For the practical difficulties, see smart grid deployment challenges.
How AI and Machine Learning Use Electricity Data
Machine learning is a set of methods that learn patterns from data. Applied to electricity data, it can support several tasks:
- Forecasting. Estimating future demand or renewable output from historical and weather data.
- Anomaly detection. Flagging readings or patterns that differ from what is expected, for human review. See AI-based anomaly detection for smart meter data.
- Classification. Sorting events or equipment into categories, such as types of disturbance.
- Decision support. Prioritizing alerts, summarizing information and presenting options to engineers and operators.
These methods use historical data to learn and real-time data to apply what was learned. Their outputs are estimates and leads, not guarantees. A model can only reflect conditions present in its data, and it can degrade when conditions change. Machine learning does not replace engineering judgment. An engineer’s understanding of physics, topology and operating practice is what lets a team judge whether a result is plausible. It is also worth asking whether simpler methods will do, as discussed in machine learning versus traditional utility analytics. For an overview of applications, see artificial intelligence in smart grids.
Electricity Data for Predictive Maintenance and Asset Management
Predictive maintenance aims to use condition information to decide when equipment needs attention, instead of relying only on fixed schedules or failure. Useful inputs include loading history, temperature, test results, inspection findings and maintenance records. Analytics can combine these to estimate which assets may be at higher risk, which helps prioritize limited inspection and replacement effort.
Several cautions apply. Failures of major equipment are relatively rare, so there may be few examples to learn from. Asset age is not the same as condition. And a model’s ranking is a starting point for engineering assessment, not a verdict. For deeper treatment, see predictive maintenance for electric utilities and risk-based asset management.
Electricity Data in Demand Forecasting and Load Management
Load forecasting estimates future demand over horizons from minutes to years. Short horizons support operations and scheduling, and long horizons support capacity planning. Inputs typically include historical load, weather, calendar effects and, increasingly, information about new loads and distributed generation. See AI for electricity load forecasting and electricity demand forecasting in an electrified economy.
Load management and demand response use data to shift or reduce demand at certain times, for example by sending signals or pricing information to customers or controllable devices. Their effectiveness depends on accurate measurement of baseline demand, on customer participation and on the design of the program. Forecasts always carry uncertainty, and good practice presents ranges and tests them against actual outcomes.
The Growing Importance of Electricity Data With Renewable Energy and Electrification
Two trends increase the value of good data. First, renewable generation is variable and often connected at distribution level, so output and network effects must be forecast and monitored. Second, electrification adds loads such as electric vehicle charging and heat pumps that change when and where demand occurs. See EV charging and grid capacity and how electrification changes distribution planning.
When history is a weaker guide to the future, measurement of what is actually happening on local networks becomes more valuable. Granular data can help planners see where capacity is tightening, but the pace of change differs widely between regions and networks. For the demand side, see why electricity demand is increasing.
How Electricity Data Helps Engineers Make Better Decisions
Good data supports engineering decisions in concrete ways:
- Evidence for design and planning. Measured load shapes and voltage profiles make capacity and reinforcement decisions more specific.
- Faster diagnosis. Event records and measurements help locate and understand faults.
- Verification. Measurements can confirm whether a change, such as a tap adjustment or new equipment, had the expected effect.
- Prioritization. Data helps compare many candidate actions against limited budget and time.
Importantly, data informs judgment and does not replace it. Engineers still decide what is acceptable, what is safe and what trade-offs to accept, and they remain accountable for those decisions. The ability to question a dataset, for example by asking whether a pattern could be a metering artifact, is part of professional practice.
Opportunities for Energy Businesses and Technology Providers
Growth in electricity data also creates opportunities for organizations beyond utilities. Distribution system operators, grid planners, electrical engineers and data scientists each play a role. Software providers build data platforms, analytics and visualization tools. Energy service companies use data to design efficiency, flexibility and onsite generation services. Technology leaders decide where to invest and how to organize teams.
Opportunities include analytics services, data integration, monitoring tools and consulting, but they depend on regulation, data access rules, privacy requirements and customer trust, which differ by jurisdiction. Providers that understand both power systems and data are better able to build tools that engineers actually use. Businesses should avoid assuming that data alone creates value. The value comes from decisions and processes that use it.
Electricity Data and the Future of Engineering Careers
For engineers and students, the growing role of data changes the skills that are useful. Strong electrical fundamentals remain the base. Alongside them, data literacy, statistics, programming and an understanding of how measurement systems work are increasingly valuable. Roles that mix these abilities exist in utilities, technology providers, consultancies and research, but titles and requirements vary widely, and nothing here promises any particular career outcome.
Practical ways to build these skills include working with public datasets, building small analysis or forecasting projects, learning to query and visualize time-series data and seeking exposure to real systems under supervision. Domain knowledge is what turns generic data skills into useful engineering skills, so it pays to combine both.
Data Quality, Interoperability, Privacy and Cybersecurity Challenges
Several challenges affect almost every electricity data effort.
- Data quality. Inaccurate calibration, missing values, duplicates and wrong units can mislead analysis. See why smart meter data quality matters and how utilities detect missing smart meter data.
- Timestamps and time synchronization. Combining sources only works if time references are consistent, including time zones and daylight saving changes.
- Sampling frequency. Data recorded too slowly cannot show fast events, and data recorded too fast may be costly to store and process.
- Interoperability. Systems from different suppliers and eras may use different formats, identifiers and definitions.
- Governance and access control. Organizations need clear ownership, rules about who can see and change data and records of how it is used.
- Privacy. Consumption data can reveal information about households, so it should be handled lawfully, minimized and protected.
- Cybersecurity. Connected meters, sensors and data platforms need protection, and the integrity of data matters as much as its confidentiality. IT and OT boundaries require careful management.
Turning Electricity Data Into Actionable Insights
Collecting data is not the same as using it. Turning it into insight involves several translations:
- From raw to processed. Validate, clean, align and contextualize measurements.
- From processed to analytical. Choose methods that fit the question, whether simple summaries, statistics or machine learning.
- From analysis to recommendation. Express findings in terms decision-makers understand, with uncertainty and limitations stated.
- From recommendation to action. Embed the result in a workflow with an owner, a decision point and a way to record what happened.
Many initiatives stall at the last step. An accurate dashboard that nobody uses does not change anything. Designing for the user and the decision from the start prevents this.
A Practical Framework for Utilities and Engineering Teams
A phased approach helps organizations improve electricity data capabilities without trying to fix everything at once.
- Identify the operational problem and intended decision. State what decision the data should support and who will make it.
- Inventory available data sources and their quality. List what exists, where it lives, how it is recorded and how reliable it is.
- Establish ownership, access controls and governance. Assign responsibility for each dataset and define who may access or change it.
- Integrate and validate relevant datasets. Link sources using consistent identifiers and time references, and check them against known conditions.
- Choose suitable analytical methods. Start with the simplest method that could answer the question and add complexity only when justified.
- Test results against real operational conditions. Compare outputs with field knowledge, past events and expert judgment, including unusual cases.
- Integrate validated insights into workflows. Provide results where and when staff need them, with training and clear responsibilities.
- Monitor performance and continuously improve. Track data quality and usefulness over time, and revise as conditions and needs change.
A Hypothetical Example: From Meter Readings to Better Grid Decisions
This is an illustrative, hypothetical example. It contains no real data, results, savings or percentages, and it is not a case study.
Imagine a utility that receives occasional complaints about low voltage on a residential feeder during early evenings, and its planners suspect a recurring peak-demand issue on one distribution transformer. The team decides to investigate using three kinds of electricity data.
- Smart meter readings. Interval consumption from customers connected to the transformer, linked through the network model.
- Transformer loading records. Loading information from monitoring or periodic measurement, along with the rating and condition history.
- Voltage measurements. Readings from meters or sensors at various points along the feeder.
The team would proceed along these lines:
- Check the data. Confirm that meters are correctly mapped to the transformer, timestamps are aligned and gaps are understood. Errors in connectivity could point the analysis at the wrong equipment.
- Aggregate and compare. Add up customer demand by interval and compare it with transformer loading records, to see whether they tell a consistent story.
- Examine timing. Look at whether voltage dips line up with demand peaks, and consider other possible causes such as upstream conditions, tap settings or switching.
- Consider context. Ask whether new loads, such as electric vehicle charging or other equipment, have recently appeared, and whether weather played a role.
- Develop options. Engineers evaluate responses such as adjusting voltage settings, rebalancing load, upgrading equipment or encouraging off-peak use, weighing cost and feasibility.
- Decide and verify. After a change, collect further data to check whether the issue was resolved, and document what was learned.
The example shows the chain from raw measurements to processed datasets, analysis and an operational decision. It also shows the limits. Interval data cannot show very short events, mapping errors can mislead and different causes can produce similar symptoms. Related ideas appear in how smart meter data supports grid operations and transformer loading explained.
Key Metrics for Evaluating Electricity Data Programs
To know whether an electricity data program is working, organizations need measures that are relevant to their own goals. The metrics below are examples, and no universal target values are implied. Each organization should set thresholds based on its needs, its systems and the decisions at stake.
| Metric | What it indicates | Notes |
|---|---|---|
| Data completeness | Share of expected data that is present | Consider whether gaps are random or systematic |
| Accuracy | How closely data matches reality or a trusted reference | Depends on calibration and validation methods |
| Timeliness | How soon data is available relative to when it is needed | Different uses need different speeds |
| Forecast error | Difference between forecasts and actual values | Choose error measures suited to the data; some behave poorly near zero values |
| Alert quality | Share of alerts that are useful versus false or low value | Too many false alerts reduce trust and increase workload |
| Actionability | Whether insights lead to useful operational actions | Track decisions influenced, not only dashboards produced |
| Reliability of the pipeline | How consistently data systems run and recover | Include monitoring of failures and latency |
| Total cost and effort | Resources needed to maintain the program | Include integration, storage, security and staff time |
Compare against a baseline recorded before changes, and be cautious about crediting data initiatives for improvements that may have other causes, such as weather or workload. For reliability measures used in utility performance reporting, see how utilities measure grid reliability.
Common Mistakes to Avoid
- Collecting data without a decision in mind. Data with no owner or purpose becomes a storage cost.
- Ignoring data quality. Building models on unvalidated data produces confident but unreliable results.
- Overlooking timestamps and topology. Misaligned time or wrong connectivity can quietly corrupt analysis.
- Choosing complex methods too early. Simple approaches are easier to explain and may be enough.
- Treating AI output as fact. Models give estimates that need validation and engineering review.
- Neglecting privacy and security. Customer and operational data require protection from the start.
- Leaving out the people who use the data. Operators, planners and field staff know things datasets do not.
- Not measuring results. Without baselines and evaluation, it is impossible to know whether a program helps.
Practical Checklist for Electricity Data Programs
- What decision will this data support, and who makes it?
- Which data sources are needed, and who owns each one?
- Do we know the sampling frequency, time reference and completeness of each source?
- Are identifiers and network connectivity records consistent across systems?
- Who may access, change and share the data, and how is that recorded?
- How are privacy and cybersecurity risks managed?
- What is the simplest method that could answer the question?
- How will results be validated against real operating conditions?
- How will insights reach the people who act on them?
- What baseline and metrics will we use to judge success?
- Who maintains the pipeline and monitors quality over time?
The Future of Electricity Data
Several developments may shape how electricity data is used, though pace and scope will differ among utilities and regions:
- More measurement at the grid edge. Growth in distributed energy resources, storage and flexible loads may increase the number of data sources.
- Better integration. Improved data models and interfaces may make it easier to combine operational and enterprise data.
- Wider use of analytics and AI. Forecasting, anomaly detection and decision-support tools are likely to see continued development, with human oversight remaining central.
- Greater attention to governance. Privacy, security and data quality are likely to receive more focus as data becomes more critical.
These are directions of exploration and not predictions. For related outlooks, see future smart grid technology.
Conclusion: Why Electricity Data Will Keep Growing in Importance
Electricity data is becoming more important because modern power systems are more variable, more connected and more dependent on timely information. It spans consumption, electrical measurements, generation, network records, meter data, equipment condition and market information. Its value comes from moving carefully from raw measurements to trustworthy processed data, from analysis to decisions and from decisions to action, with engineers remaining accountable. Utilities, engineers and energy businesses that invest in data quality, governance, interoperability and skills, and that evaluate results honestly, are better placed to benefit. Strong electrical fundamentals, combined with data literacy and good judgment, remain the most durable foundation, whatever tools come next.
Frequently Asked Questions About Electricity Data
What is electricity data?
Electricity data is recorded information about the generation, delivery, consumption, condition or economics of electrical energy. It includes meter readings, voltage, current and frequency measurements, generation and network records, equipment condition information and market data.
How does electricity data work?
Devices such as meters and sensors measure electrical quantities and events, communication networks carry the data to central systems, and those systems validate, store and organize it. Engineers and analysts then turn processed data into analysis that supports decisions in operations, planning and maintenance.
Why is electricity data important?
Power systems must balance supply and demand continuously while protecting equipment. Electricity data gives engineers and operators visibility of present conditions, evidence from past behavior and inputs for forecasting, which becomes more important as renewable generation and new loads make networks less predictable.
What are the main components of electricity data?
The main types are consumption and demand data, voltage, current, frequency and power measurements, generation and renewable data, network data, smart meter and AMI data, equipment condition and maintenance records, and market and operational data. Supporting components include timestamps, metadata and data management systems.
What are the challenges of electricity data?
Common challenges include data quality problems, inconsistent timestamps, missing values, interoperability between systems, unclear ownership and access rules, customer privacy, and cybersecurity. Insights also have to be turned into workflows so they lead to useful actions.
Where is electricity data used?
It is used in grid operations, outage detection, load and renewable forecasting, voltage monitoring, asset health and maintenance planning, loss analysis, demand response, billing and market settlement, and in network planning for electrification and distributed energy. How useful it is in each case depends on data quality and context.

I share real stories, practical ideas and honest perspectives on business, marketing and life. This blog is a space to learn, grow and connect.


